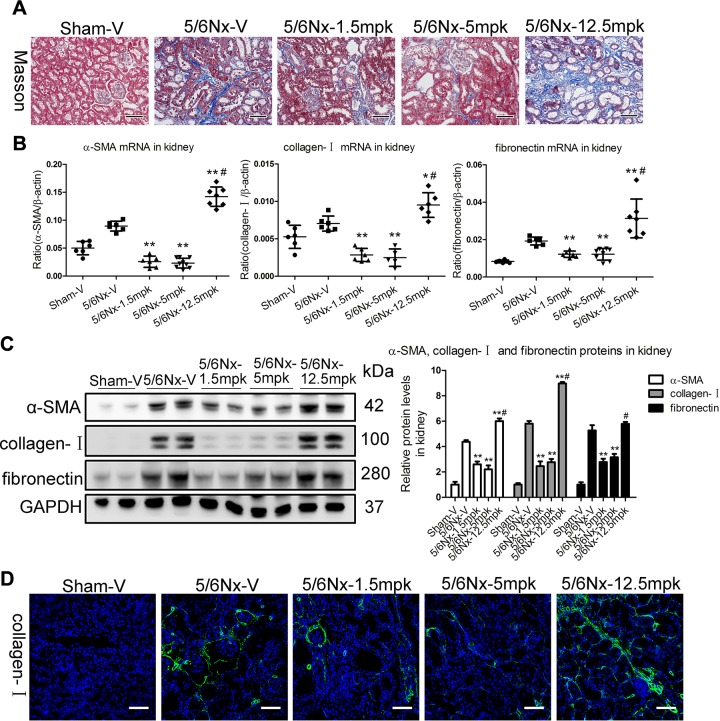
Figure 3.
Dose-dependent biphasic effects of MK on TIF in vivo. A) Representative images of Masson staining of the kidney. Scale bars, 100 μm. B, C) α-SMA, collagen-I, and fibronectin mRNA and protein expression in the cortex of kidney, as determined by real-time PCR (B) and Western blotting (C). GAPDH, glyceraldehyde 3-phosphate dehydrogenase. D) Representative images of collagen-I immunostaining. Scale bars, 100 μm. Data are presented as the means ± sem of 6–9 mice. *P < 0.05, **P < 0.01 vs. 5/6Nx-V, #P < 0.01 vs. 5/6Nx-5 mpk.

