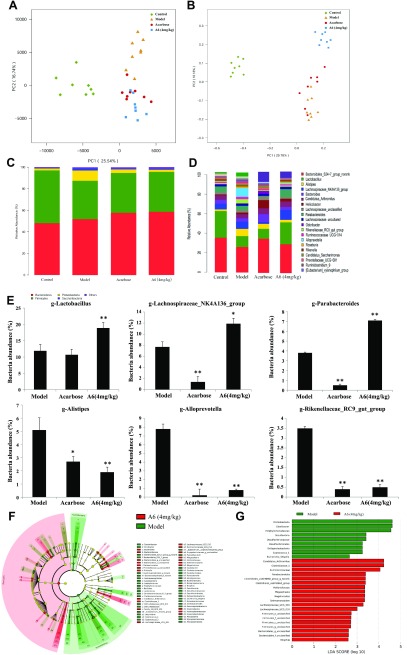
Figure 3.
Structural modulation of gut microbiota by compound A6 in db/db mice. PCA score plot of the gut microbiota (A), PCoA score plot of the gut microbiota based on unweighted UniFrac metrics (B), response of gut microbiota at the phylum levels to different dose of A6 treatment (C), response of gut microbiota at the phylum levels to different dose of A6 treatment (D), comparison of the taxonomic abundance among the indicated groups (E) (n = 8/group). Data are presented as the means ± sem. The statistical significance in bacterial abundance among the different samples was assessed by the 1-way ANOVA after a post hoc Fisher’s LSD test. *P < 0.05, **P < 0.01. F) LEfSe taxonomic cladogram, different colors suggest enrichment of certain taxa in model group (green) and A6 (4 mg/kg, red). G) LDA score, an LDA score greater than 2 indicated a higher relative abundance in the corresponding group than in the other 2 groups.

