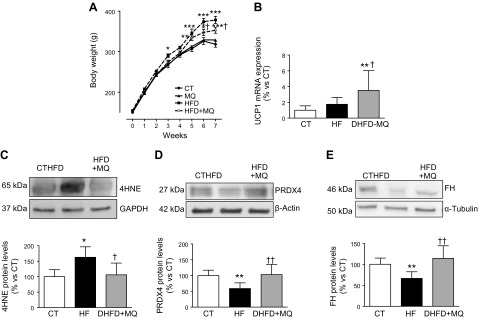
Figure 1.
A) Body-weight evolution along the study. B) UCP1 mRNA levels in BAT. C–E) Protein levels of 4-HNE adducts (C), PRDX4 (D), and FH (E) in EAT from control rats fed a CT and rats fed an HFD treated with vehicle or with the mitochondrial antioxidant MitoQ (MQ; 200 µM). Bar graphs represent the means ± sd of 6–8 animals normalized for reference housekeeping. *P < 0.05, **P < 0.01 vs. control group, †P < 0.05, ††P < 0.01 vs. HFD group.

