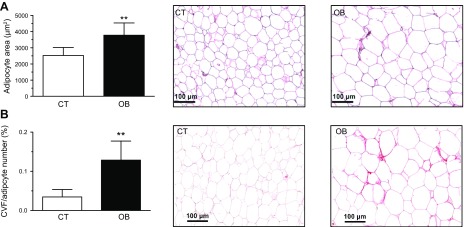
Figure 6.
A) Quantification of adipocyte area (left) and representative microphotographs of visceral adipose tissue sections from control subjects and patients with morbid obesity (OB) stained with hematoxylin-eosin examined by light microscopy (original magnification, ×20; right). B) Quantification of collagen volume fraction normalized for adipocyte number (CVF). Right panel shows representative microphotographs of visceral adipose tissue sections from these individuals stained with picrosirius re-examined by light microscopy (original magnification, ×20). Bar histograms represent the means ± sd of 7 subjects. Scale bar, 100 µm. **P < 0.01 vs. control group.

