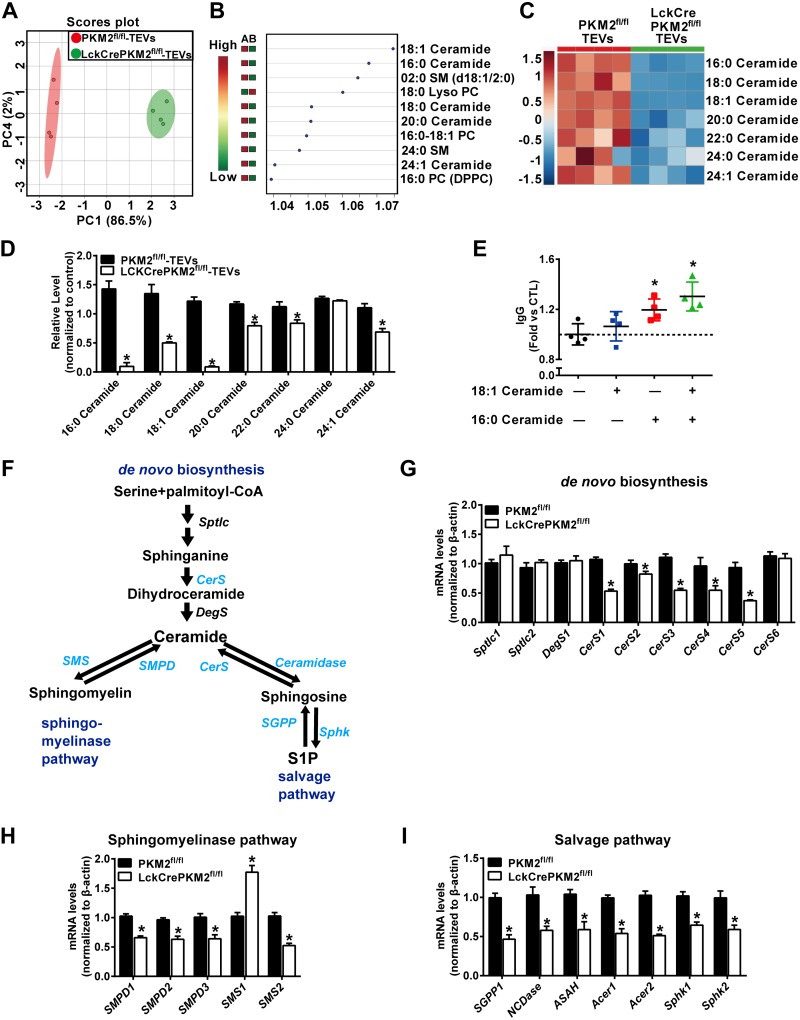
Figure 3.
Secondary perturbation of lipid metabolites in EVs secreted from PKM2-null T cells. HPLC-MS/MS analysis of lipid metabolites in EVs isolated from T-cell culture supernatants. A) PCA scatter plot of the lipid metabolites in TEVs. B) VIP scatter plot identified by PCA analysis showing the top 10 lipid metabolites in PKM2fl/fl-TEVs and LckCrePKM2fl/fl-TEVs. A: PKM2fl/fl-TEVs, B: LckCrePKM2fl/fl-TEVs. C) Heat map of changes in the TEV ceramide profile. D) The relative levels of ceramide metabolites, normalized to TEV protein levels, are presented. TEV protein levels were normalized to lysate total protein. E) IgG levels in the B-cell culture supernatants after 18:1 ceramide and 16:0 ceramide stimulation for 72 h. Ctl, control. F) Ceramide synthesis pathways: the de novo, sphingomyelin hydrolysis, and salvage pathways. G–I) The mRNA levels of enzymes required for de novo ceramide synthesis (G), sphingomyelin hydrolysis (H), and the salvage pathway that recreates ceramide from sphingosine (I) in T cells of PKM2fl/fl mice and LckCrePKM2fl/fl mice; n = 4, data are presented as means ± sd. *P < 0.05 vs. the PKM2fl/fl-TEVs group (D, G–I) or control group (E) (1-way ANOVA followed by Tukey’s test for multiple comparisons).

