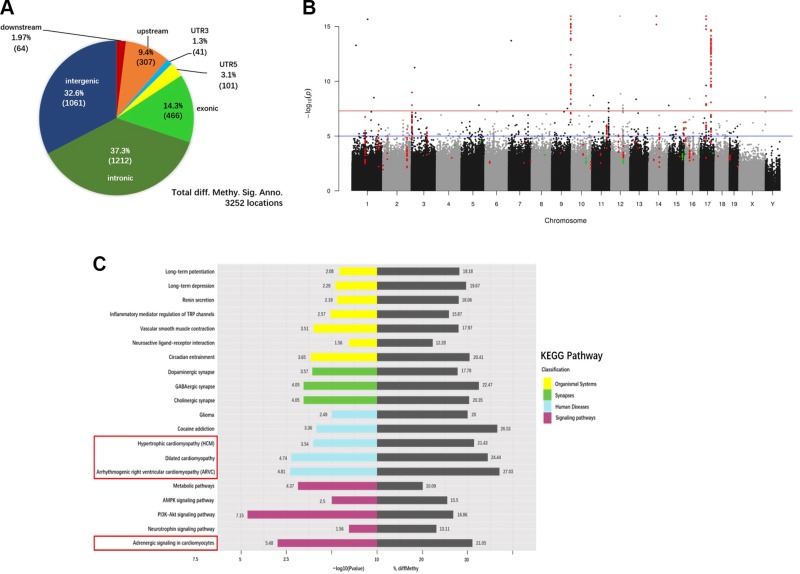
Figure 5.
Differential DNA methylation of cardiac genes in CRS mice. A) Pie chart showing the distribution of the 3252 DMRs annotated to specific genomic regions. B) Manhattan plot of P values. Each point represents a CpG site (n = 10,624,115) with the chromosomal position along the x axis and the negative logarithm of the associated P value on the y axis. The blue and red lines represent P values of 1e−05 and 1e−08, respectively. The numbers of CpG sites that showed significantly greater or reduced methylation levels in CRS hearts compared with NS controls were 308 (red) and 35 (green), respectively. C) The top 20 significantly enriched KEGG pathways in CRS hearts, based on the analysis of the 3252 DMRs. Gray bars represent the percentage of differentially methylated genes (% diffMethy) relative to the total number of background genes in different KEGG pathways. Colored bars represent the P values of differentially methylated genes, expressed as −log10 values.

