Figure 5.
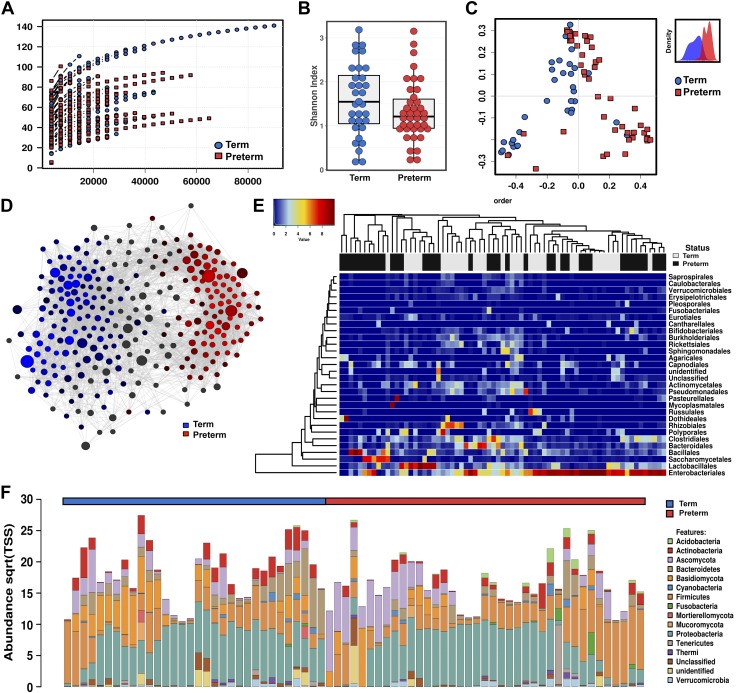
Fungi and bacteria form complex interkingdom microbial communities in human meconium. A) Sequencing rarefaction analysis of species richness. B) α diversity quantified by the Shannon index, ANOVA f = 2.2, P = 0.14. C) PCoA of Bray-Curtis dissimilarity matrices, PERMANOVA with 999 permutations R2 = 0.103, P = 0.000333. The subset displays a discriminant analysis of principal components. D) Network analysis developed using Spearman’s correlations. Positive correlations with FDR-adjusted values of P <0.05 are presented as an edge. Nodes indicate specific bacterial or fungal taxa, with the relative number of significant connections indicated by the size of the node. E) Heat map of differential distribution of taxa at the order level, ranked by gestation. Gold is set to a value of 0.5, representing equal distribution; red is set to a value of >0.5, indicating a positive correlation; and blue is set to a value of <0.5, indicating a negative correlation. F) Relative abundance of taxa at the phylum level. Sqrt(TSS), square root total sum normalization (Hellinger transformation). For all analyses (n = 71), preterm samples are displayed in red and term samples in blue.

