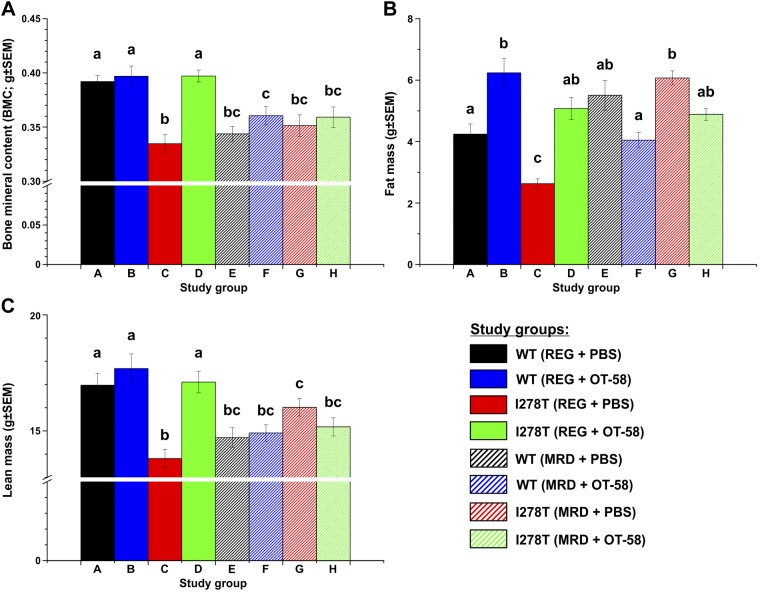
Figure 6.
Bone mineralization and body composition assessed by DXA. The DXA scans were performed when the mice reached age of 22 wk. Individual panels show BMC (A), fat mass (B), and lean mass (C). Bars represent a mean value from individual mice, and error bars indicate sem. Significance is designated by letters (a–c) at the top of the error bars. Columns that are significantly different from each other (P < 0.05) are indicated with different letters. Two letters indicate that the column is not significantly different from the single letter–designated columns.

