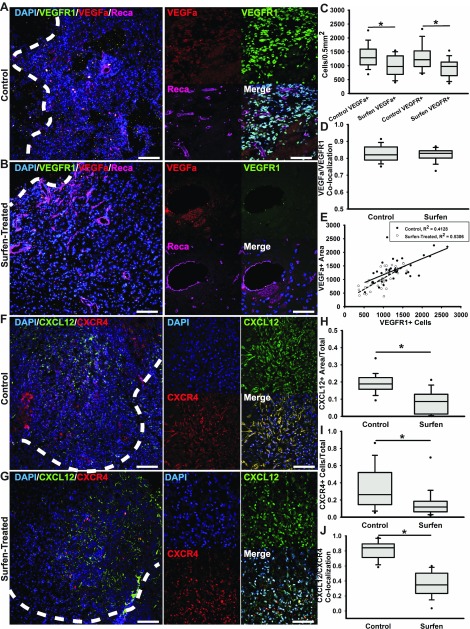
Figure 7.
Surfen treatment decreases angiogenesis and chemokine signaling in F98 tumors. A) Representative low-magnification epifluorescence imaging of control tumor periphery with insets containing high-magnification confocal images of the nuclear marker DAPI, VEGFa, VEGFR1, and endothelial cell marker Reca. Scale bars, 100 and 50 µm. B) Representative low-magnification epifluorescence imaging of control tumor periphery with insets containing high-magnification confocal images of the nuclear marker DAPI, VEGFa, VEGFR1, and endothelial cell marker Reca. Scale bars, 100 and 50 µm. C) Cell density quantifications of cells positive for either VEGFa or VEGFR1 across control and surfen-treated tumor tissue. D) Colocalization quantification for VEGFa and VEGFR1 between control and surfen-treated tumor tissue. E) Correlation analysis between amounts of VEGFa present and VEGFR1+ cells. F) Representative low-magnification epifluorescence imaging of control tumor periphery with insets containing high-magnification confocal images of the nuclear marker DAPI, chemokine CXCL12, and chemokine receptor CXCR4. Scale bars, 100 and 50 µm. G) Representative low-magnification epifluorescence imaging of surfen-treated tumor boundaries with insets containing high-magnification confocal images of the nuclear marker DAPI, chemokine CXCL12, and chemokine receptor CXCR4. H, I) Quantification for amount of detectable CXCL12 within both control and surfen-treated tissue (H) and for percentage of CXCR4+ cells within the same tissue (I). J) Colocalization analysis for CXCL12 and CXCR4 between control and surfen-treated tumor tissue. Error bars represent means ± sd. *P < 0.05, Student’s t test followed by Mann-Whitney rank-sum test.

