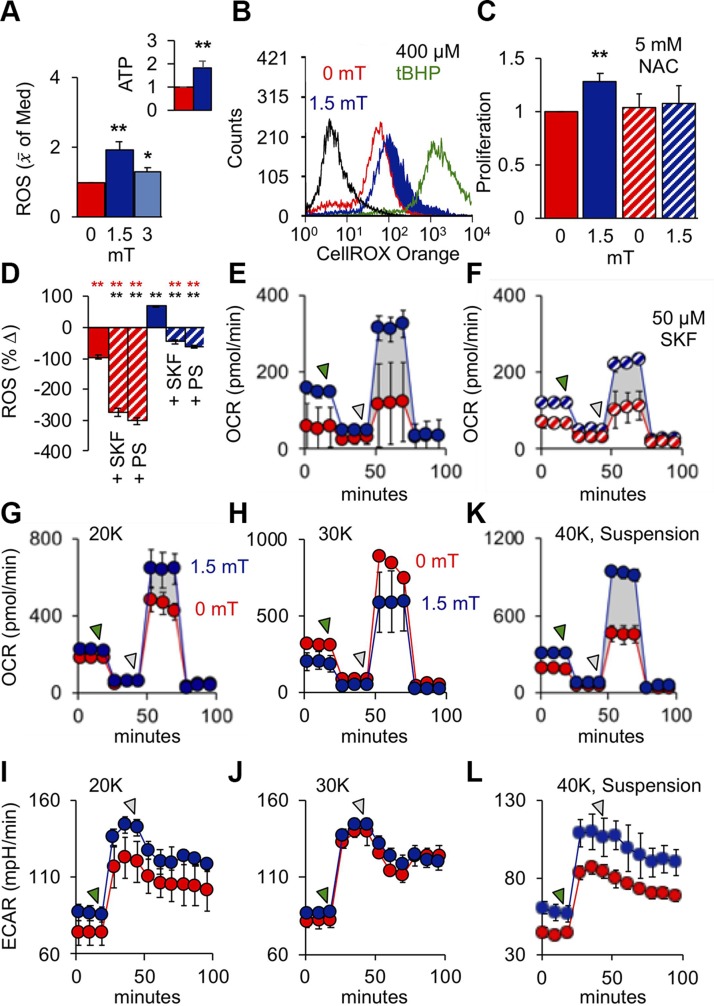
Figure 6.
PEMFs activate mitochondrial respiration upstream of myogenic enhancement. A) ROS (H2O2) production in response to PEMF exposure and normalized to that at 0 mT; n = 6. Inset: SKF-inhabitable ATP production 30 min following PEMF exposure (10 min at 1.5 mT); n = 3. B) ROS production in response to exposure to PEMFs or 400 µM tert-butyl hydroperoxide (tBHP; 1 h; green). C) Normalized proliferation (relative 0 mT) in response to PEMF exposure with and without N-acetylcysteine (NAC); n = 9. D) Percentage change in ROS production immediately after PEMF exposure with and without PS (PS; 1%) or SKF-96365 (SKF; 50 µM). Data shown indicate ROS quantification 6–8 min after reading commenced. E, F) Mitochondrial OCR in response to PEMF exposure without (E) and with (F) SKF-96365. G–J) OCR and ECAR in myoblasts plated at 20,000 (G and I, respectively) and 30,000 (H and J, respectively) per well. K, L) OCR (K) and ECAR (L) in myoblasts exposed to PEMFs in suspension and then plated at 40,000 myoblasts/well 5 h before measurement. The green- and gray-shaded arrows indicate points of addition of oligomycin (ATP synthase inhibitor; 1 µM) and carbonyl cyanide 4-(trifluoromethoxy) phenylhydrazone (mitochondrial proton ionophore; 1 µM), respectively. Unless otherwise stated, all PEMF exposures (blue) was applied for a duration of 10 min at an amplitude of 1.5 mT with (hatched) or without (solid) drugs as indicated; red represents correspondent control scenarios. **P < 0.01 with regard to correspondent 0 and 1.5 mT scenarios, respectively.

