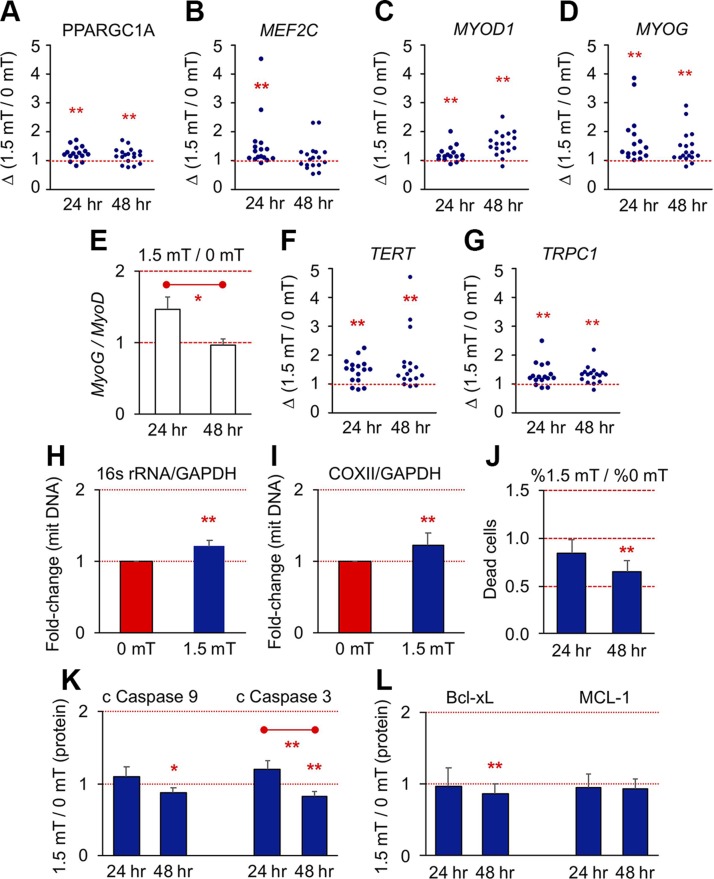
Figure 9.
PEMFs promote mitochondriogenesis and functional adaptations. A–D, F, G) Gene expression scatter plots at 24 and 48 h post-PEMF treatment for the indicated genes. E) Myogenin (MyoG) to MyoD ratio at 24 and 48 h following PEMF exposure. For gene expression at early time points, the highest value at 16 or 24 h was taken. Also see Table 3. H, I) Change in mitochondrial DNA relative to nuclear DNA 24 h post-PEMF for 16s rRNA/GAPDH (H) and cytochrome c oxidase subunit II (COXII)/GAPDH (I); n = 6 ± sd. J) Differential percentage of Trypan Blue positive (dead) cells after 24 and 48 h post-PEMF exposure; n = 7 ± sem). K, L) Proapoptotic (K) and antiapoptotic (L) protein expression at 24 and 48 h post-PEMF exposure as indicated; n = 12 ± sem. *P < 0.05, **P < 0.01 (with regard to correspondent 0 mT control scenario or as indicated by bar). All data represent the mean of n independent experiments each pertaining to the means of biological triplicates.

