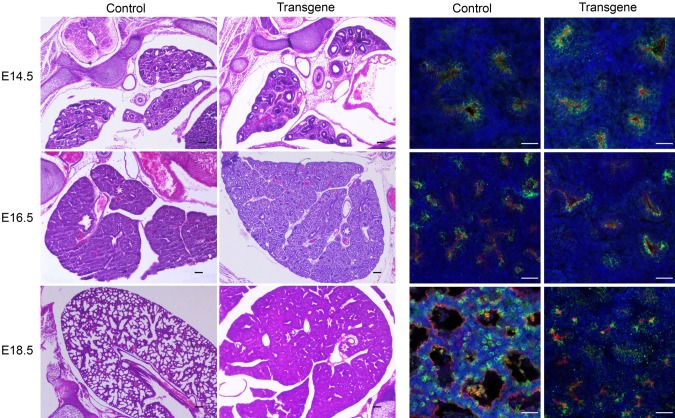
Figure 3.
Morphologic characterization of control and transgenic lungs during embryonic development. H&E staining (left panels) and immunofluorescent staining (right panels) of control and transgenic lungs from E14.5, E16.5, and E18.5 embryos. Red, PDPN; green, proSFTPC; blue, DAPI. Scale bars, 25 μM.

