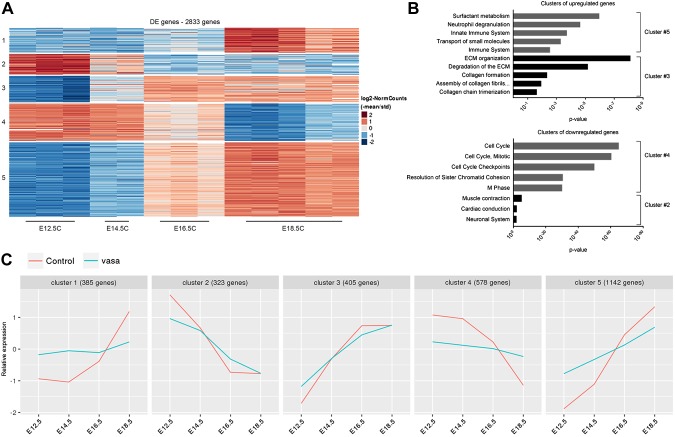
Figure 4.
Gene expression patterns during normal and transgenic lung embryonic development. A) Clustering analysis of differentially expressed (DE) genes during normal lung embryonic development reveals 5 major clusters. The heatmap represents the relative expression level for each gene across the samples. B) Enriched pathways in each of the 5 clusters (based on the MouseMine tool). In cluster 4, only the top 5 pathways are presented. C) Comparison between the normal and transgenic clusters. Each horizontal line represents the median relative expression for all of the genes across the cluster. Note that the lines represent only relative expression levels but not absolute values. Therefore, only the dynamics of gene expression can be compared in this analysis. For a detailed description of the analysis, see Materials and Methods.

