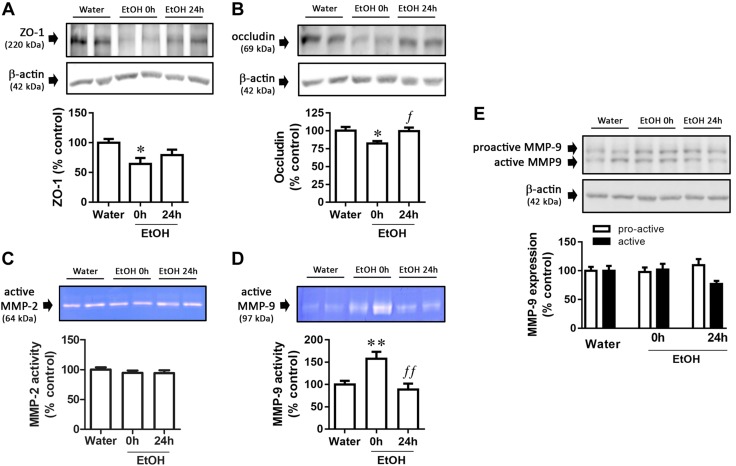
Figure 3.
Gut-barrier alterations after CI EtOH exposure. A, B) Graph and representative immunoblots of CI EtOH effects on ZO-1 (A) and occludin (B) expression. C, D) Gelatinolytic bands in zymograms corresponding to the active MMP-2 (64 kDa) (C) and MMP-9 (97 kDa) (D) enzymes. E) MMP-9 expression data and representative immunoblot. Results are shown as means ± sem; n = 6–8. *P < 0.05, **P < 0.01 (different from water); fP < 0.05, ffP < 0.01 (different from EtOH 0 h).

