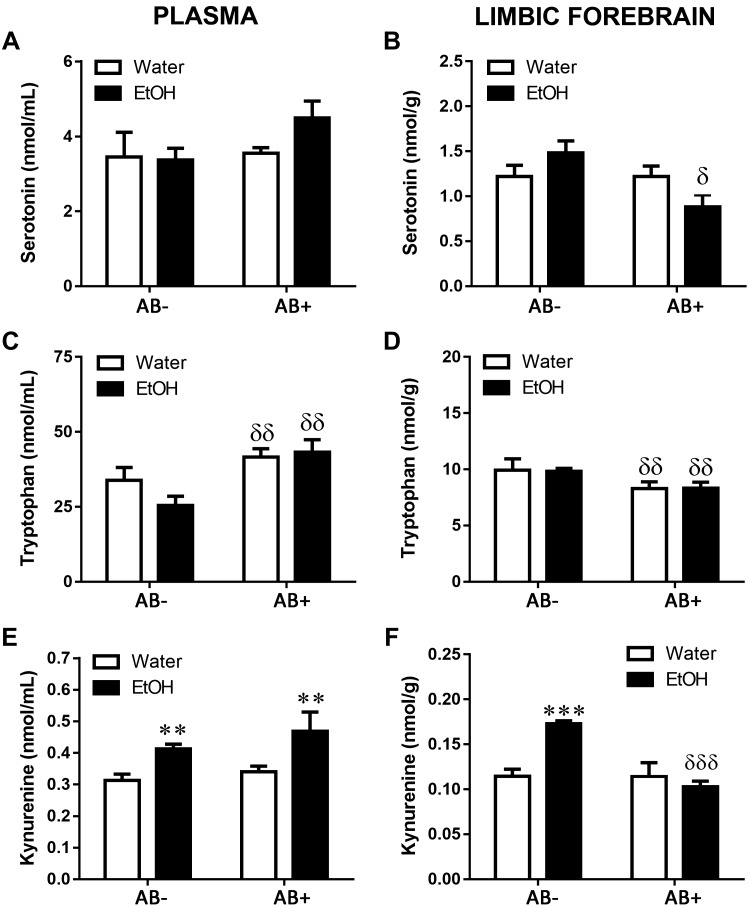
Figure 7.
Effects of antibiotic treatment (AB) on changes induced immediately after CI EtOH exposure on 5-HT concentration in the plasma (A) and limbic brain (B), Trp concentration in the plasma (C) and limbic brain (D), and Kyn concentration in the plasma (E) and limbic brain (F). Results are shown as means ± sem; n = 5–8. **P < 0.01, ***P < 0.001 (different from the corresponding water group); δP < 0.05, δδP < 0.01, δδδP < 0.001 (different from the corresponding group not treated with antibiotic).

