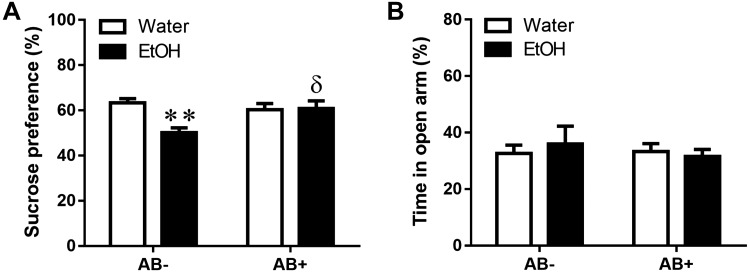
Figure 8.
Effect of CI EtOH exposure and antibiotic (AB) administration on anhedonia, in the sucrose preference test and on anxiety-related behaviors in the EPM. A) Preference for sucrose was calculated as a percentage of sucrose solution intake per total liquid intake. B) Graph showing the percentage of time spent in the open arm of overall test. Results are shown as means ± sem, n = 7–8. **P < 0.01 (different from the corresponding water group); δP < 0.05 (different from the corresponding group not treated with antibiotic).

