Figure 1.
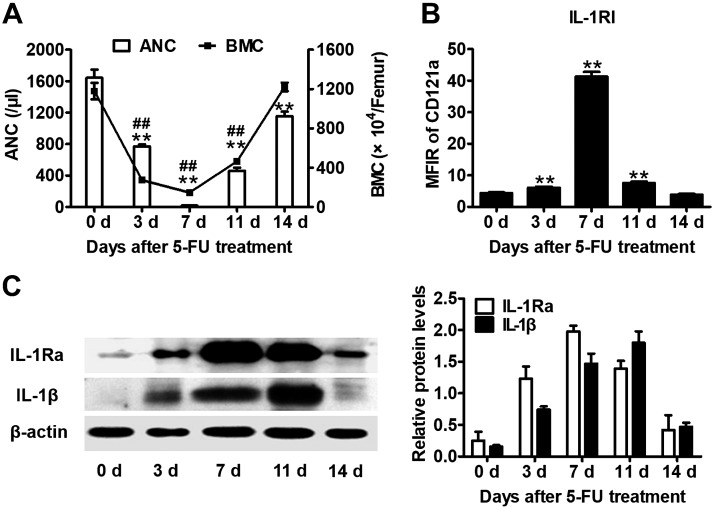
BM expression of IL-1β, IL-1Ra, and IL-1RI was associated with 5-FU–induced BM injury and postinjury recovery. Peripheral blood cells and BMCs from mice treated with 5-FU (100 mg/kg) were analyzed at the indicated time points. A) The bar graph indicates the mean ± sem of the ANC. The solid line represents the mean ± sem of the BMC count. **P < 0.01, ANC vs. baseline at d 0; ##P < 0.01, BMC vs. baseline at d 0 (n = 6). B) IL-1RI expression was determined by CD121a analysis in BMCs with flow cytometry. The bar graph indicates the mean ± sem of the mean fluorescence intensity ratio (MFIR) of CD121a to isotype control. **P < 0.01 vs. baseline at d 0 (n = 6). C) Western blot analysis of IL-1Ra and IL-1β proteins in BMCs at the indicated time points after 5-FU treatment. The bar graph on the right indicates the relative expression of IL-1Ra and IL-1β (n = 3/time point). The signal density was quantified after normalization to an internal β-actin signal.

