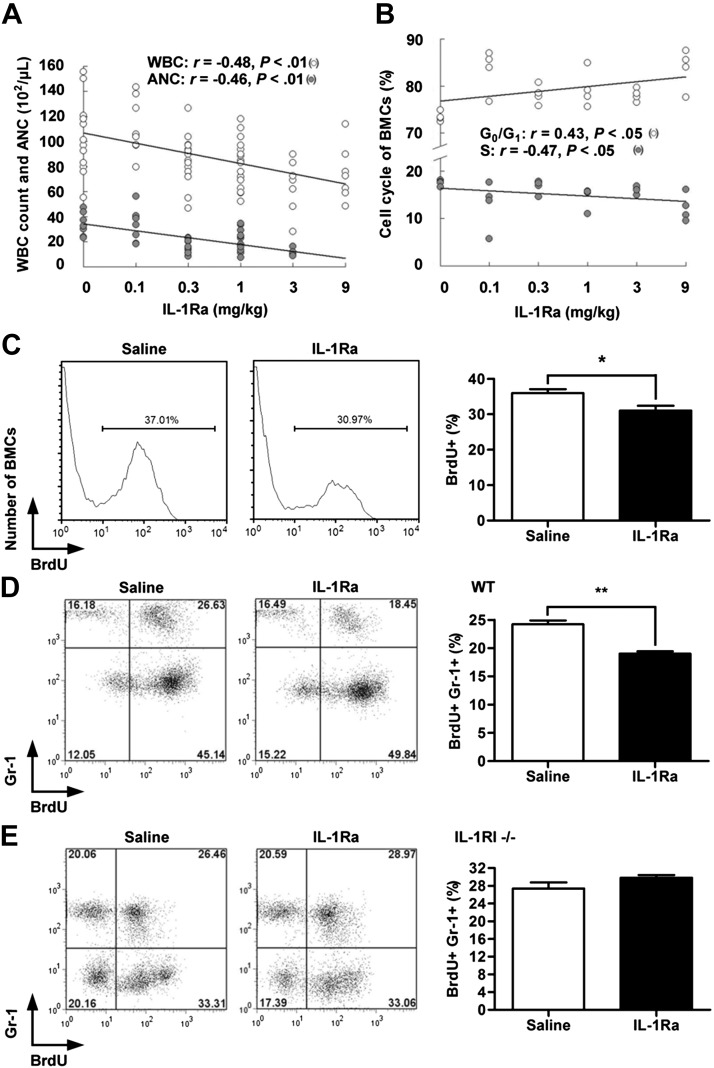
Figure 3.
rhIL-1Ra suppressed steady-state BM granulopoiesis. A, B) Blood differential counts (A) and BMC cycle analysis (B) in mice treated daily with rhIL-1Ra or saline for 5 d. A) The correlations between rhIL-1Ra dosage and WBC or ANC were plotted (r, Pearson correlation coefficient); P < 0.01 (n = 7–12). B) The correlations between rhIL-1Ra dosage and percentages of BMCs in the G0/G1 or S phase were plotted (r, Spearman correlation coefficient); P < 0.05 (n = 4). C) Mice received rhIL-1Ra (1 mg/kg/d) or saline for 5 d followed by BrdU injection (100 mg/kg). BMCs isolated 3 h later were analyzed by flow cytometry. The bar graph on the right indicates the mean percentages ± sem) of BrdU+ BMCs. *P < 0.05 (n = 6). D) Mice received rhIL-1Ra (1 mg/kg/d) or saline for 5 d and BrdU injection (100 mg/kg) before euthanasia. BMCs were analyzed for Gr-1 and BrdU by flow cytometry. The bar graph on the right indicates the mean percentage ± sem of BrdU+Gr-1+ cells. **P < 0.01 (n = 5). E) A similar approach was used in IL-1RI−/− mice; P > 0.05 (n = 5) (D).

