Figure 4.
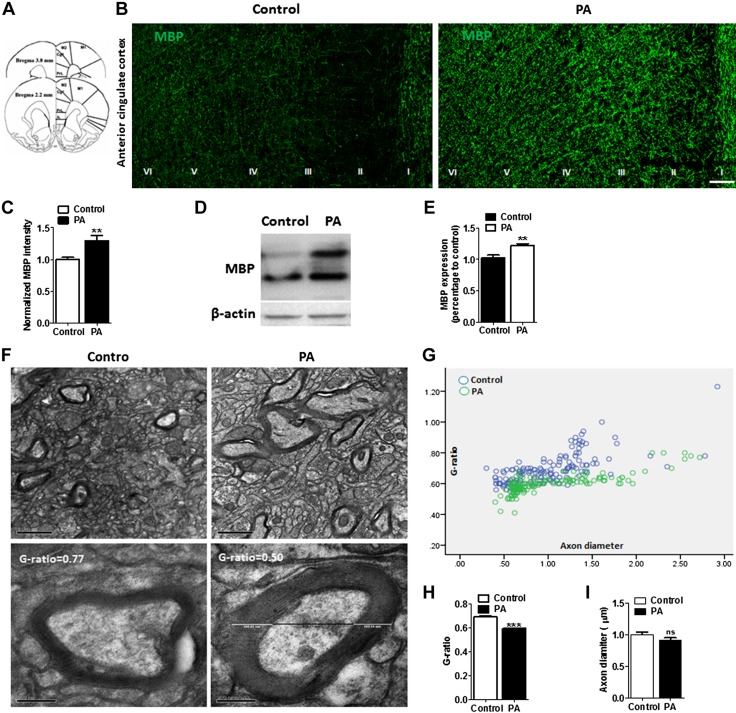
Prolonged PA training promotes adaptive myelination in rats. A) Schematic picture reconstructing the location of ACC (gray outlining). Cc, corpus callosum; Cg1, cingulate cortex, area 1; Cg2, cingulate cortex, area 2; PrL, prelimbic cortex. B) Representative confocal images of MBP in the ACC region show enhanced expression of MBP in PA trained rats compared with untrained controls. Scale bar, 100 µm. C) Relative intensity of MBP fluorescence in the ACC (layer I–VI), sections from 2.2 to 3.8 mm from the bregma. The MBP mean fluorescent intensity (n = 6) was increased after PA training (n = 6). D) Western blot images of MBP and β-actin in the ACC extracts from untrained control and PA trained rats using anti-MBP antibody. E) Mean MBP intensity analysis revealed that PA trained rats have higher myelin intensity compared with control rats (n = 6 rats/group). F) EM images of ACC showing myelinated axons in control and PA rats (n = 3 rats/group). Scale bar, 1 µm (upper panel). Lower panel shows representative EM pictures of myelinated axon at higher magnification (scale bar, 200 nm). G) Scatter plot of G-ratios in control rats (blue circle, n = 3 rats) and PA rats (green circle, n = 3 rats). H) Mean G ratio of myelinated axons in the ACC region in PA trained and untrained control rats. I) Axonal diameters do not change significantly between PA trained and control rats (n = 150–203 axons from 3 rats/group). Ns, not significant. Data are shown as means ± sem. **P < 0.01, ***P < 0.001 (unpaired Student’s t test).

