Figure 6.
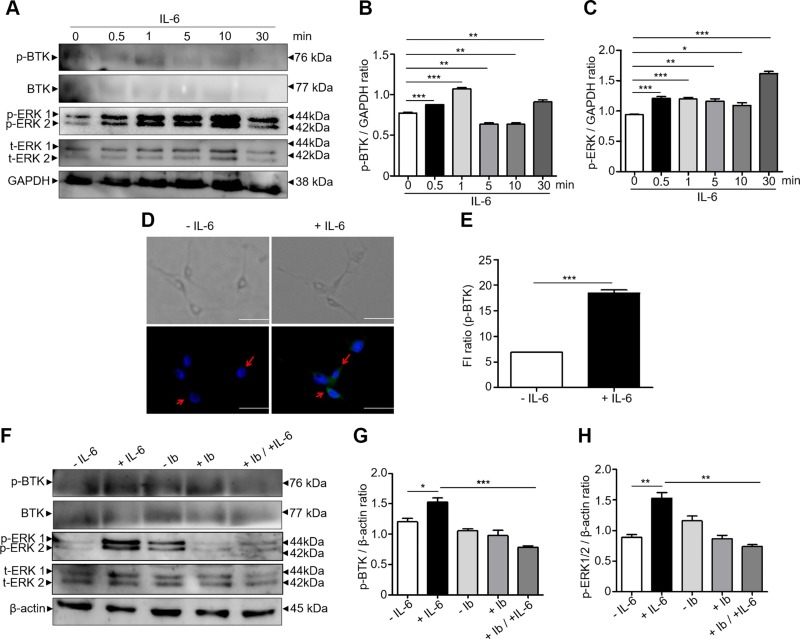
Activation of p-BTK and p-ERK by IL-6. A) Western blot analysis of protein expressions of p-BTK, BTK, p-ERK 1/2, t-ERK 1/2, and GAPDH in DRG cells treated with mouse recombinant IL-6 (100 ng/ml) for 0, 0.5, 1, 5, 10, and 30 min. B, C) The ratios of intensities of p-BTK (B) and p-ERK 1/2 (C) relative to GAPDH were illustrated. D, E) Immunostaining (D) of p-BTK (green dots; arrows) and nuclei (DAPI blue dots) and quantification (E) of fluorescent intensities of p-BTK in DRG cells treated with or without IL-6 for 1 min. Scale bars, 100 μm. F) Western blot analysis of the expressions of p-BTK, BTK, p-ERK 1/2, t-ERK 1/2, and β-actin in DRG cells treated with or without IL-6 in the presence or absence of ibrutinib (Ib). G, H) The ratios of intensities of p-BTK (G) and p-ERK 1/2 (H) relative to β-actin were displayed. The mean ± se from 3 separate experiments was calculated (ns, not significant). ***P < 0.001.

