Figure 7.
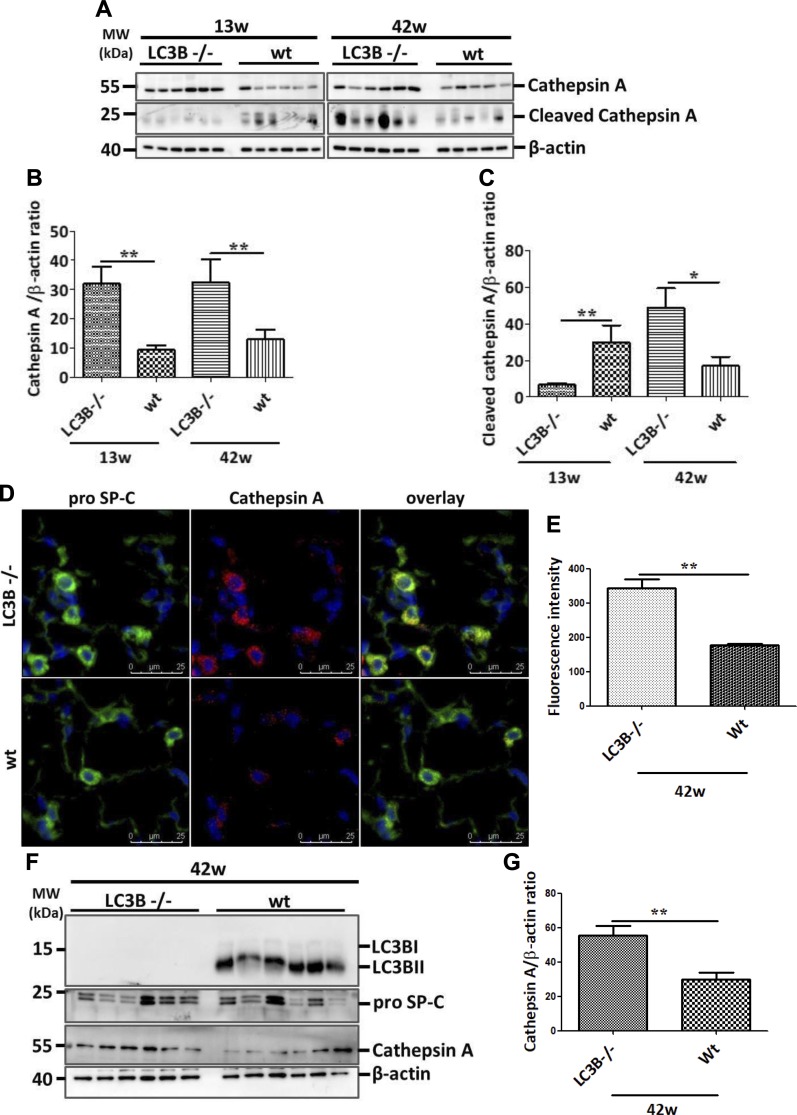
Increase in cathepsin A in LC3B−/− mice. A–C) Western blot analysis (A) of lung homogenates of 13-wk-old (left) or 42-wk-old (right) LC3B−/− and WT mice for cathepsin A (pro form), for cleaved form of cathepsin A and β-actin followed by their densitometric quantifications in (B, C) respectively. D) Immunofluorescence staining on paraffin sections from 42-wk-old LC3B−/− or WT control mice for the AECII marker, proSP-C (green), and cathepsin A (red). DAPI was used to stain the nuclei in blue. E) Cathepsin A fluorescence signal intensity was quantified and depicted as a bar graph. F) Representative Western blots for the indicated proteins from primary AECII isolated from 42-wk-old LC3B−/− or WT mice. G) Densitometric quantification for cathepsin A from AECII is shown. Representative blots and analysis from n = 5 mice/group and 3 independent experiments are shown. *P < 0.05, **P < 0.01.

