Figure 5.
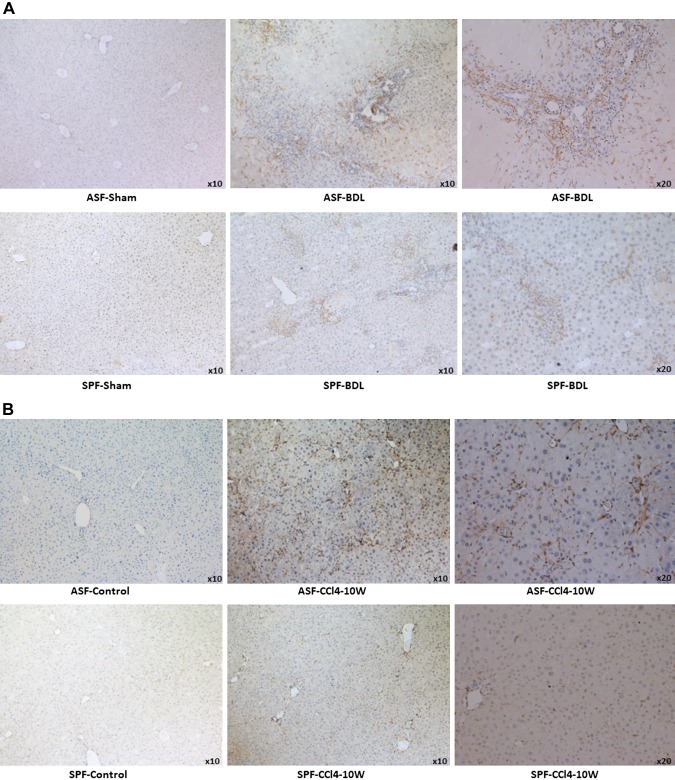
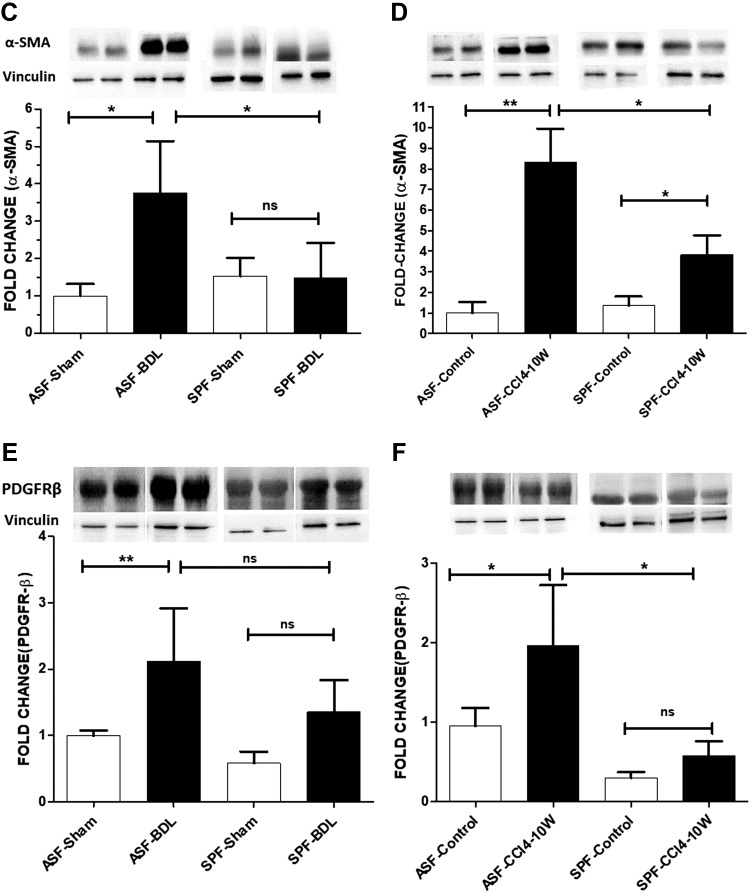
Evaluation of HSC activation by IHC of α-SMA, protein expression of α-SMA, and PDGFR-β. A) Representative images showing liver sections of ASF-sham vs. ASF-BDL (upper panel) and SPF-sham vs. SPF-BDL mice (lower panel), 14 d after BDL. B) Liver sections of ASF-Control vs. ASF-CCl4 (upper panel) and SPF-Control vs. SPF-CCl4 (lower panel), α-SMA positive staining (brown). C, D) Western blotting with protein quantification of α-SMA in livers of ASF-sham vs. ASF-BDL and SPF-sham vs. SPF-BDL mice (C), ASF-control vs. ASF-CCl4 or SPF-control vs. SPF-CCl4 mice (D). E, F) PDGFR-β protein expression with quantification from livers in BDL mice (E) or in CCl4-treated mice (F). The original blots are provided in Supplemental Fig. S7A, B. Ns, not significant. Data are expressed as means ± sd; n = 5–6/group. *P < 0.05, **P < 0.005, ***P < 0.0005.


