Figure 1.
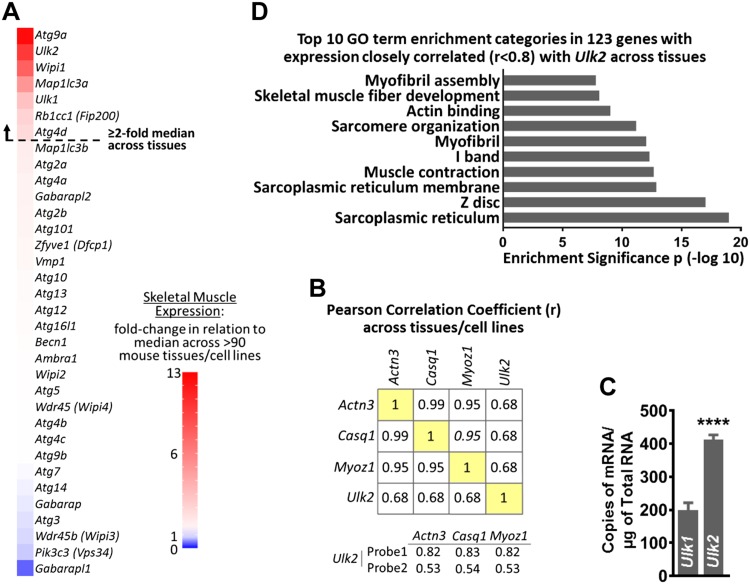
Ulk2 is enriched in skeletal muscle. BioGPS data set: Gene Atlas MOE430, gcrma (30) was used for A, B, D. A) Skeletal muscle expression of 34 putative autophagy genes expressed as fold change over median expression across multiple mouse tissues and cell lines. B) Mean correlation between skeletal muscle–specific genes and Ulk2. C) mRNA copy number of Ulk2 and Ulk1 in plantaris skeletal muscle of mice with normal food access (n = 9). D) DAVID functional annotation clustering analysis showing the top 10 Gene Ontology (GO) categories of genes with the highest expression correlation with Ulk2 across tissues (r ≥ 0.8; r2 ≥ 0.64). Actn3, actinin 3; Casq1, calsequestrin 1; Myoz1, myozenin 1. Data are means ± sem. ****P < 0.0001.

