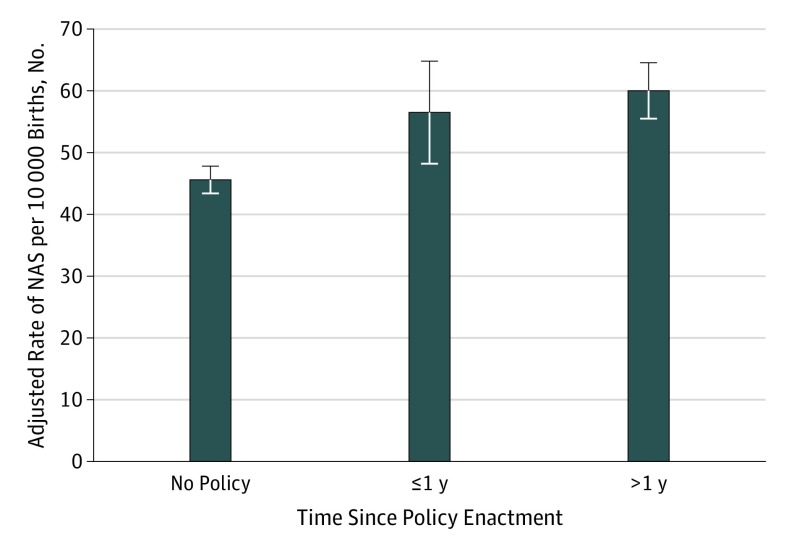
Figure. Annual Rates of Neonatal Abstinence Syndrome (NAS) per 10 000 Live Births Stratified by State Punitive Policies.
The adjusted rate of NAS per 10 000 live births for neonates was estimated from the regression model conditional on residing in states without punitive policies, during the first full calendar year after punitive policies went into effect, and with punitive policies in effect for more than 1 full calendar year, while keeping all other covariates at their original values. Error bars indicate 95% CI.

