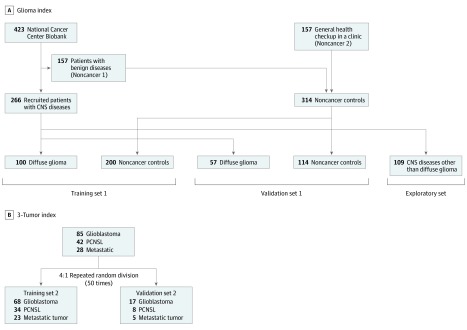
Figure 1. Flowchart of the Development of the Glioma Index and the 3-Tumor Index.
A, For the Glioma Index, samples were divided into training set 1, validation set 1, and the exploratory set. Noncancer control samples were collected from the National Cancer Center Biobank (noncancer 1 controls) and the general population undergoing routine health checkup at a clinic in Yokohama, Japan (noncancer 2 controls). B, For the 3-Tumor Index, samples were divided randomly into 2 groups (4:1, training set 2 and validation set 2) to develop models for discriminating between glioblastoma (GBM), primary central nervous system (CNS) lymphoma (PCNSL), and metastatic brain tumors.

