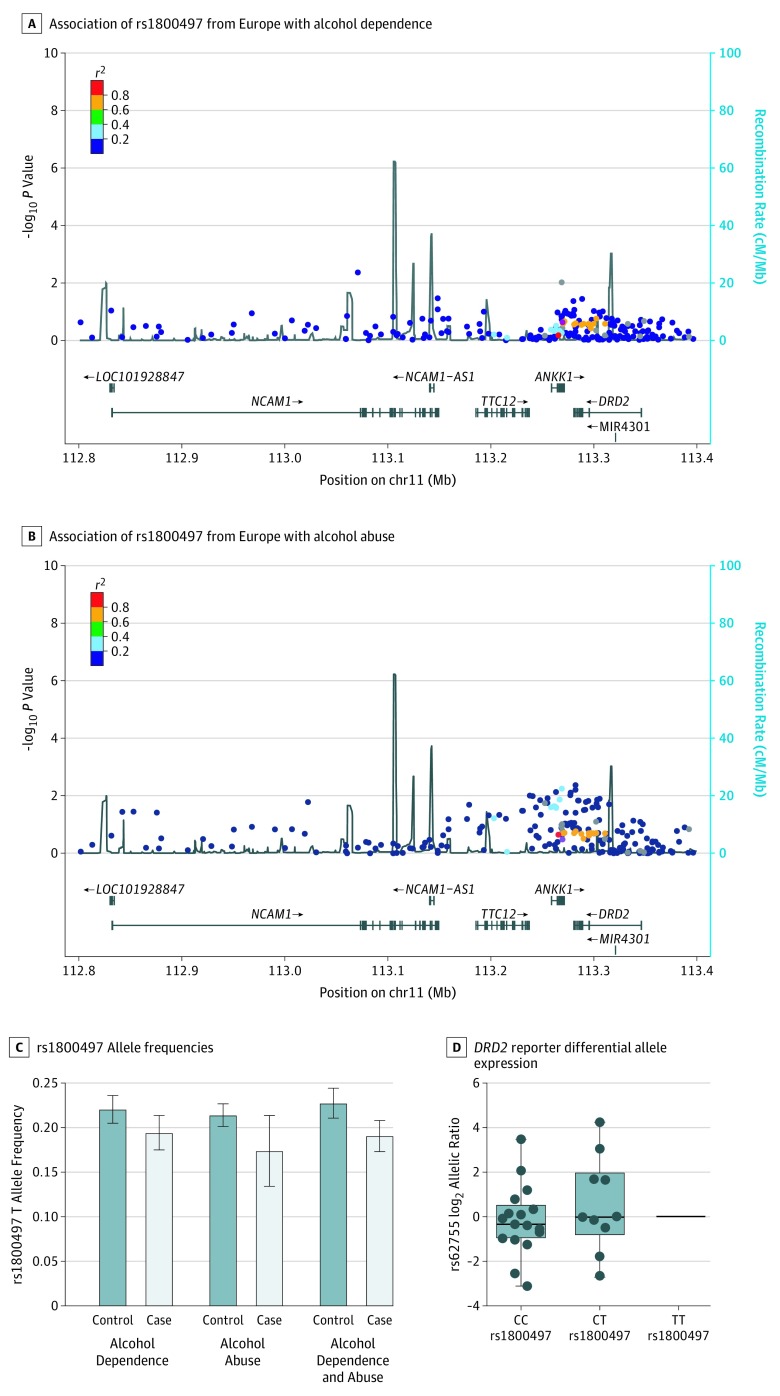
Figure 4. Linkage and Function in the D2 Dopamine Receptor Gene (DRD2) Region.
A and B, Regional association plots of rs1800497 and a total of 220 SNPs in the DRD2 region are shown for alcohol dependence (A) and alcohol abuse (B) among 641 Finnish participants. Parallel local association plots are shown for 501 Native American and 583 African American participants in eFigures 6 and 7 in the Supplement. Single-nucleotide polymorphisms (dots) are color coded according to linkage disequilibrium (LD) with rs1800497 (red dot) on a scale of r2 0 to 1. Estimated recombination rates (lines) reflect local LD structure in the 600 kb buffer around rs1800497 (red dot) in the Finnish population. C, rs1800497 allele frequencies did not differ between cases and controls. Vertical lines and whiskers denote 95% CIs. D, Differential allelic expression (DAE) of DRD2 detected as deviation from 1:1 ratio of the alleles at a reporter locus (rs62755), indicating a cis-acting locus differentially driving DRD2 transcript expression in 28 human postmortem brains heterozygous for the reporter locus, and identified from a larger number of brains. As shown, rs1800497 genotype is not associated with DRD2 DAE (Kruskal-Wallis test, χ23 = 0.7579; P = .68; Levene test, F = 2,25; P = .38). Top and bottom of boxes are 25th and 75th percentiles, respectively, lines inside boxes are medians, vertical lines are 10th and 90th percentiles, respectively, and circles denote individual data points. C indicates cytosine; and T, thymine.

