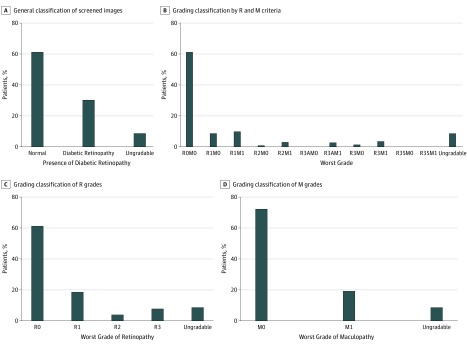
Figure 2. Total Proportion of Diabetic Retinopathy Screening According to Retinopathy and Maculopathy Grading at All 3 Centers.
A, General classification of screened images. B, Complete grading classification by retinopathy (R) and maculopathy (M) criteria. C, Grading classification of R grades. D, Grading classification of M grades. A indicates active; S, stable.

