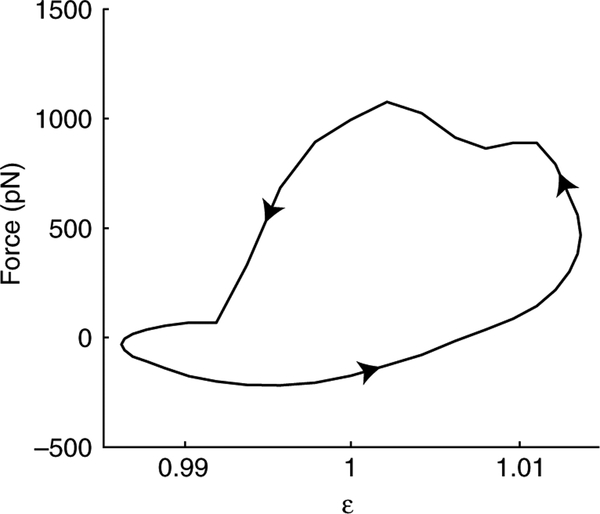
Fig. 3.
Each simulation (10 s long) produced 250 work loops, constructed from the phase portrait of force and muscle strain over any single oscillation period (40 ms). This work loop is the average phase portrait for the simulation shown in Fig. 2. The counter-clockwise direction (arrows) denotes positive work output (548.6±46.6 pN nm, mean ± s.d., N=245 work loops).

