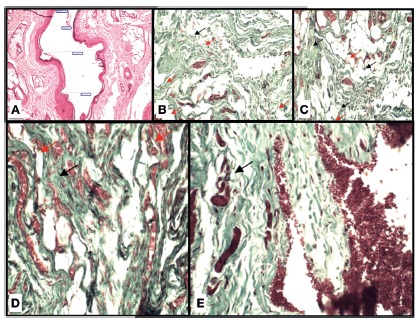
FIGURE 2. A) Photomicrography illustrating the accomplishment of the measurement of the distance of the muscular cables; B-E) photomicrographies demonstrating the degree of fibrosis: B) control group; C) fistulotomy group; D) polypropylene group; E) polydioxanone group. (Black arrows show collagen fibers and red arrows neoformation of blood vessels, GT, 20x).

