
FIGURE 3. Histological evolution (edema, congestion, polymorphonuclear, fibrosis, neovascularization and monocytes) between control and probiotic: A and B) 3PO A=control, B=probiotic; C and D) 7PO C= control; D=probiotic); E and F) 10PO E=control and F=probiotic .
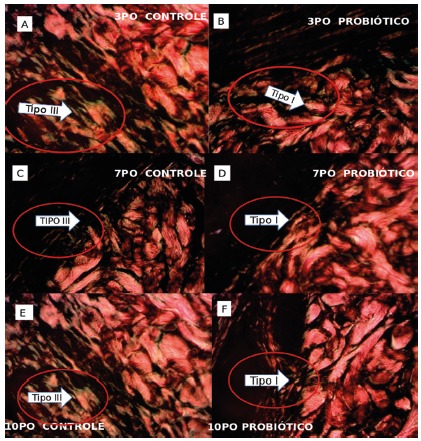
Collagen type I (stained in red) and collagen type III (stained in green); Picrosirius-red F3BA (PSR), 20x