
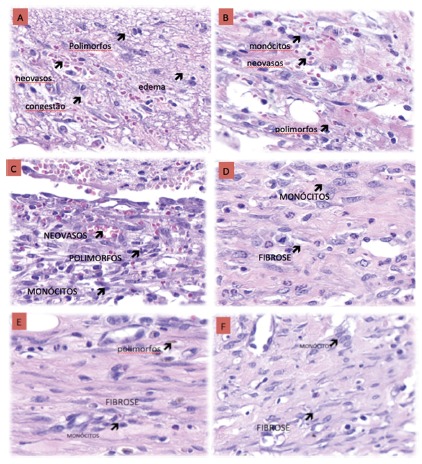
FIGURE 4. Example of histological evolution (edema, congestion, polymorphonuclears, fibrosis, neovascularization and monocytes) in both control and probiotic groups at the 3PO (A and B), 7PO (C and D) and 10PO (E and F) days.
Official websites use .gov
A
.gov website belongs to an official
government organization in the United States.
Secure .gov websites use HTTPS
A lock (
) or https:// means you've safely
connected to the .gov website. Share sensitive
information only on official, secure websites.