
Figure 2.
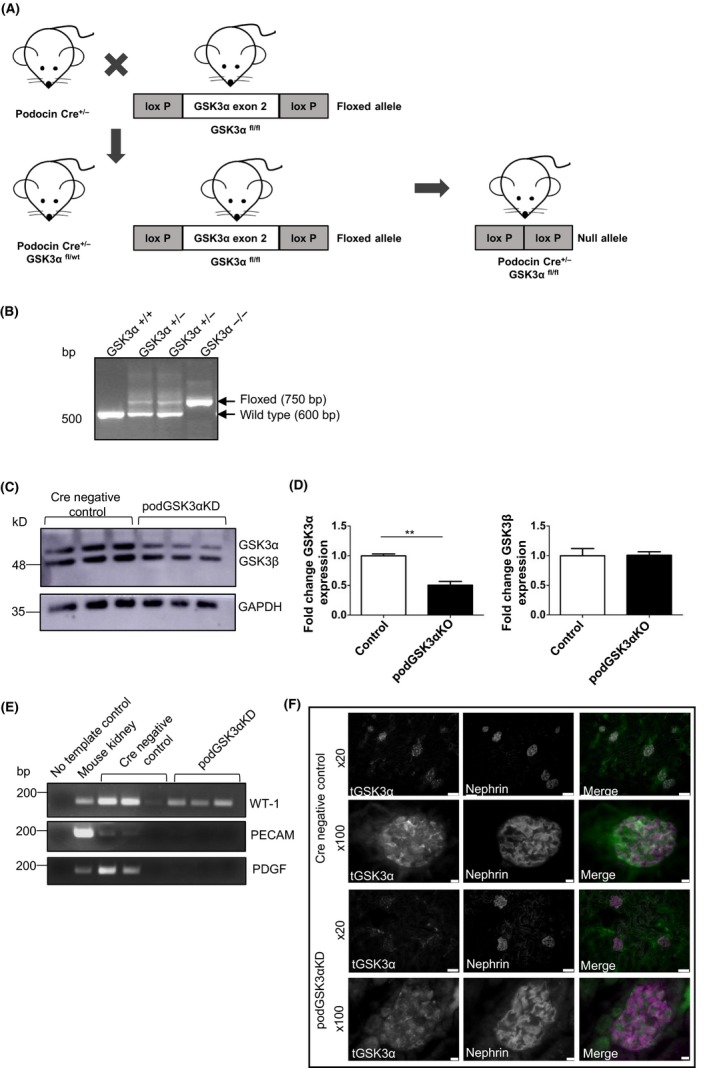
Generation of podocyte‐specific GSK3α knockdown mice. A, Breeding strategy used to generate podGSK3αKD mouse model showing deletion of GSK3α exon 2 in podGSK3αKD mice. B, Gel of end point polymerase chain reaction (PCR) products used to identify genotypes of podGSK3α mice. C, Western blot of podocyte primary culture cells from podGSK3αKD and littermate control mice. D, Densitometry of blot showing fold change of GSK3α and GSK3β levels normalized to GAPDH expression. Unpaired t test, **P < 0.01. podGSK3αKD podocytes have reduced expression of GSK3α. All primary podocytes express the podocyte marker WT‐1. E, Gel of end point PCR analysis of cDNA derived from podGSK3αKD and littermate control mice with WT‐1, PECAM and PDGF primers. Mouse kidney cDNA was used as a positive control. F, Immunofluorescent analysis of total GSK3α in podGSK3αKD and Cre negative control mice including co‐staining with the podocyte marker protein nephrin. Scale bar = 50 μm (×20); 75 μm (×100)