Figure 5.

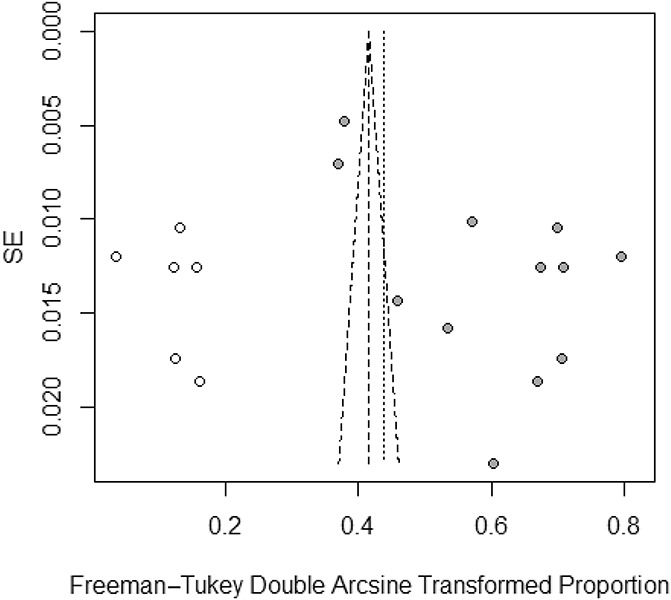
Funnel plot adjusted using the trim-and-fill method with black circles representing comparisons included and white circles representing inputted comparisons using the trim-and-fill method.

Funnel plot adjusted using the trim-and-fill method with black circles representing comparisons included and white circles representing inputted comparisons using the trim-and-fill method.