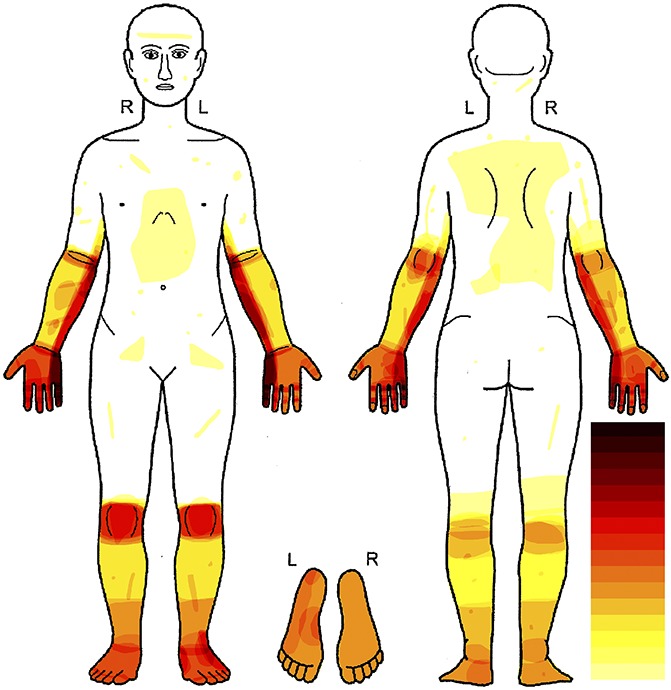
Figure 2.

Distribution of pain in patients with leprosy. Body chart showing superimposed pain areas reported by all patients with pain (n = 32). The white areas mark body parts in which no patient felt spontaneous pain. In the dark red areas, most patients felt pain. The light-yellow areas represent body parts in which few patients experienced pain, and orange and light-red areas represent a medium frequency of pain occurrence. Most pain appeared in the ulnar territory, and a second hotspot was the knees of the patients.
