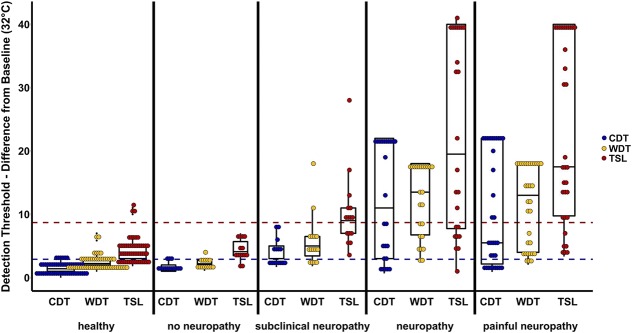
Figure 5.
Dot-box-plot of thermal detection thresholds per group. Difference from baseline (32°C) is presented. The dotted lines indicate the 95% quantile of the cold detection threshold (blue, overlying with the warm detection threshold 95% quantile) and the thermal sensory limen (red) of the healthy control group. Although the “no neuropathy” group is well within this quantile, more than half of the “subclinical neuropathy” group are beyond and could be identified by a simple thermal test. CDT, cold detection threshold; TSL, thermal sensory limen; WDT, warm detection threshold.

