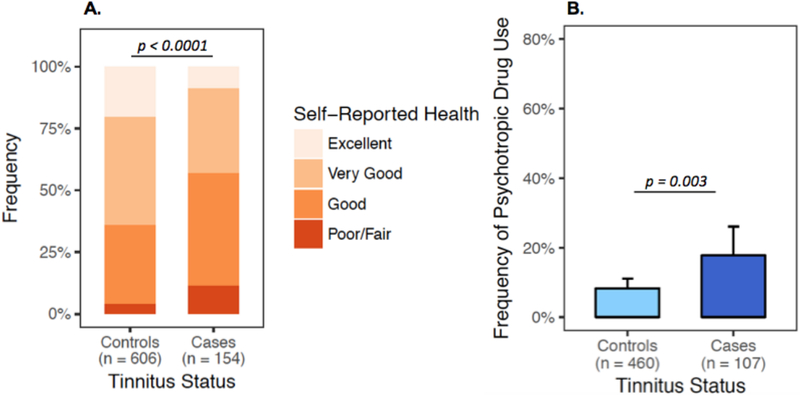
Figure 2. Self-reported Health and Use of Psychotropic Medications by Tinnitus Status.
A. Bar plot of the distribution of self-reported health according to tinnitus status. Patients were asked: “How would you rate your overall health?” and responded on a poor-excellent ordinal scale, which was converted to a numeric scale (0 = poor/fair, 1 = good, 2 = very good, 3 = excellent). Logistic regression revealed significant negative correlation between tinnitus status and self-reported health (OR=0.54, 95% CI: 0.4–0.7, P<0.0001). B. Bar plot of psychotropic medication use by tinnitus status shows significantly higher prevalence of psychotropic medication use in tinnitus cases (OR= 2.4, 95% CI: 1.3–4.4, P=0.003). Patients were dichotomized to “Yes” and “No” psychotropic medication use based on receiving medications from a list of frequently prescribed antidepressants, anxiolytics, and antipsychotics (Supplemental Methods, (15)). The number of subjects per category is presented on the x-axis. Error bars represent the binomial 95% CIs for each subgroup.

