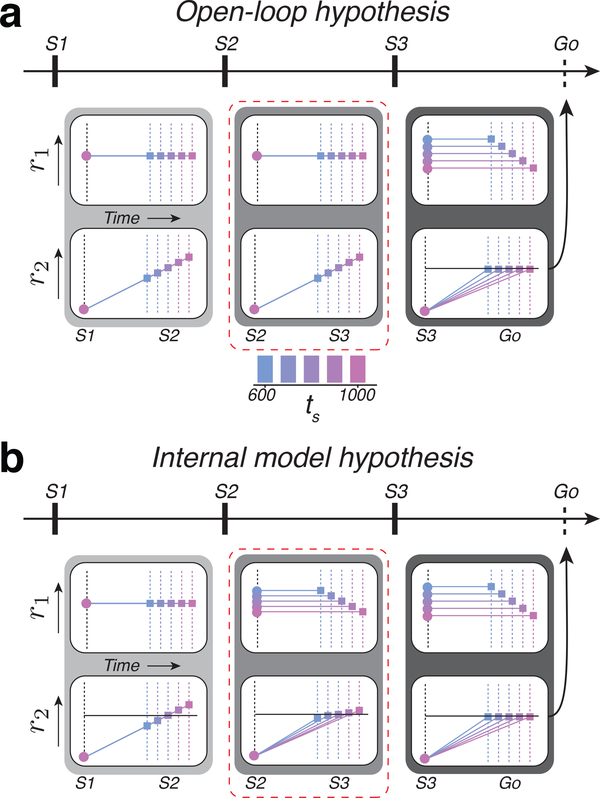
Figure 2. Predictions of the open-loop and internal model hypothesis in the 1-2-3-Go task.
a) Activity profile of two hypothetical populations, r1 and r2, under the open-loop hypothesis. Predictions are shown for each of the three epochs. r1 provides the clock and r2 integrates the clock to track elapsed time. During both the first and second epochs (light and medium gray boxes), the clock signal is independent of ts. Therefore, r2 at S2 or S3 represent the measured interval (different colored squares). These measurements set the clock speed (output of r1) according to te(S3), and, as a consequence, r2 ramps to threshold (horizontal black line) at a rate that depends on ts from S3 to Go (dark gray box). b) Activity profile under the internal model hypothesis. r1 and r2 represent the control signal and simulation, respectively. During the first epoch (light gray box), the r1 population supplies a constant speed command according to the mean of the prior. The r2 population integrates this speed command and produces ramping activity that terminates at different points depending on the sample interval, ts (different colored squares). The difference between the terminal point of r2 and the predicted terminal point based on the mean of the prior (horizontal line) provides an error that allows r1 to encode an interval-dependent speed command in the subsequent epoch (medium gray box, top). The corresponding r2 population integrates the updated speed to generate ramping activity whose slope varies with ts (bottom). The same process is repeated in the third epoch (dark gray box). Dashed red line highlights the key differences between the two hypotheses.

