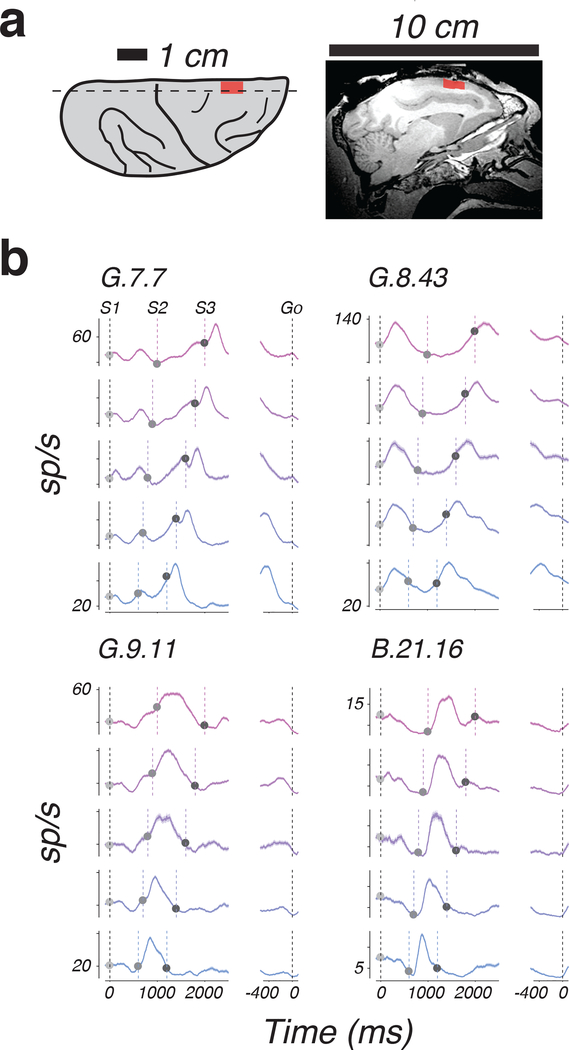
Figure 3. Example response profiles of individual DMFC neurons during 1-2-3-Go task.
a) Recording locations. Left: illustration of the dorsal aspect of the right hemisphere, showing major sulci (black lines) and the location of recordings across monkeys (red). Right: Magnetic resonance image showing a sagittal section (dashed line, Left) of the right hemisphere in monkey G; mean across two image acquisitions with similar results. Red indicates the rostral-caudal extent of recordings. b) Average response profiles for 4 example neurons aligned to S1 (left) and Go (right) sorted according to ts (colors). Shading indicates standard errors. Vertical dashed lines indicate flash and saccade times. Trial number for ts = 600, 700, 800, 900, and 1000 ms: G.7.7 – 185, 206, 72, 193, and 148; G.8.43 – 156, 169, 51, 138, and 133; G.9.11 – 178, 172, 49, 157, and 151; B.21.16 – 210, 168, 47, 176, and 173.

