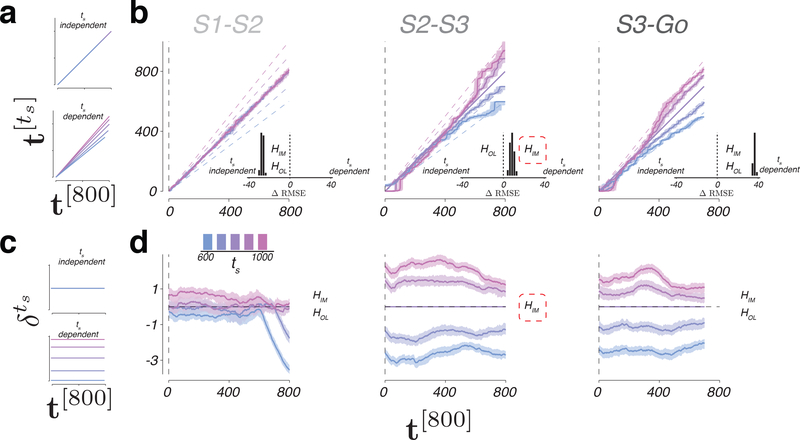
Figure 7. Relative speed and distance between neural trajectories during 1-2-3-Go.
a) ts-independent (top) or ts-dependent (bottom) representation of speed. b) Speed of each neural trajectory, , compared to the speed of the reference trajectory, Ω[800]. Colored lines show the progression of elapsed time on as a function of elapsed time on Ω[800] (t[800]) for different ts. Shadings indicate median +/− 95% confidence intervals computed from n = 100 bootstrap resamples. Unity line corresponds to no difference in speed. Dashed lines represent the expected relationship between and t[800] under the internal model hypothesis for an observer with perfect knowledge of ts. Insets: difference in RMSE under the assumption of ts-independent speed (left of zero) versus ts-dependent speed (right of zero). In S1-S2 epoch, both the open-loop and internal hypotheses (HOL and HIM) predict ts-independent speed; ts-dependent predictions were based on fits of EKF to behavior. In S2-S3 epoch, HOL predicts ts-independent speed, and HIM predicts ts-dependent speed; the data supports HIM (red dashed line). In S2-S3 epoch, both hypotheses predict ts-dependent speed. c) ts-independent (top) or ts-dependent (bottom) representation of the speed command. d) Distance between nearby states on and Ω[800] as a function of time. Horizontal dashed line corresponds to overlapping trajectories. The data supports HIM (red dashed line). Shadings indicate median +/− 95% confidence intervals computed from n = 100 bootstrap resamples. See also Supplementary Figures 10, 11, and 12.

