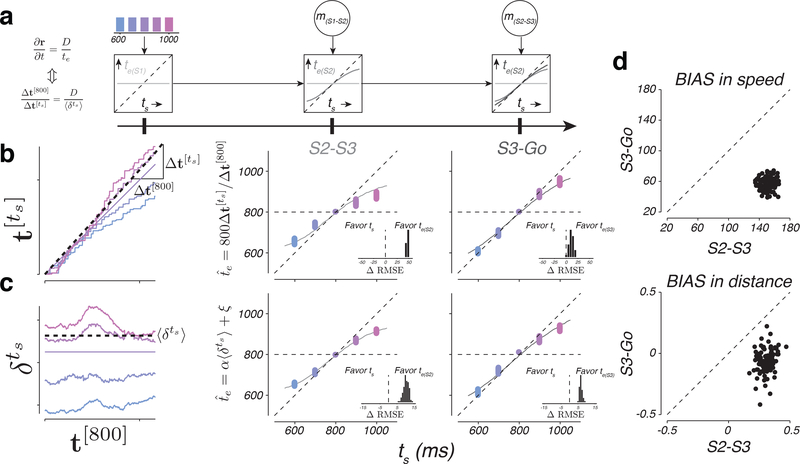
Figure 8. Speed and distance between neural trajectories reflect animals’ internal estimates.
a) Interval estimates derived from EKF model (same format as in Figure 1g). b) Interval estimate inferred from the speed of neural trajectories as a function of ts. Left: the procedure for inferring for each ts. The colored traces show as a function of t[800] for a random draw from the bootstrap distribution (see Online Methods). To infer for each ts, we measured the slope of the regression line relating to and then scaled the slope by the duration of the reference interval (800 ms). The dotted line is the regression slope for ts=900 ms. Middle and right: as a function of ts inferred from the speed of neural trajectories in the S2-S3 and S3-Go epochs. The colored dots show multiple estimates of derived from bootstrapping (n=100). The solid curves show interval estimates derived from EKF model fits (te(S2) in the middle panel and te(S3) in the right panel). Unity indicates perfect estimates of ts and the horizontal line represents the mean of the prior. Insets: difference in RMSE between models that assume that the speed of neural trajectories reflects ts versus te(S2) (middle) or te(S3) (right). Positive values indicate neural data more accurately captured by EKF. c) The value of inferred from the distance between neural trajectories as a function of ts. Left: the procedure for inferring for each ts. The colored traces show as a function of time for a random draw from the bootstrap distribution (see Online Methods). We inferred for each ts using a linear transformation of the average distance . The dotted line shows the average distance, , for ts=900 ms. Middle and right: as a function of ts inferred from the distances between neural trajectories in the S2-S3 and S3-Go epochs (same format as panel b). Insets: differences in RMSE between models assuming the distances of neural trajectories reflect ts versus te(S2) (middle) or te(S3) (right). d) Comparison of the degree of BIAS in speed (top) and distance (bottom) during the S2-S3 and S3-Go epochs. Dashed lines are unity. See also Supplementary Figure 13.

