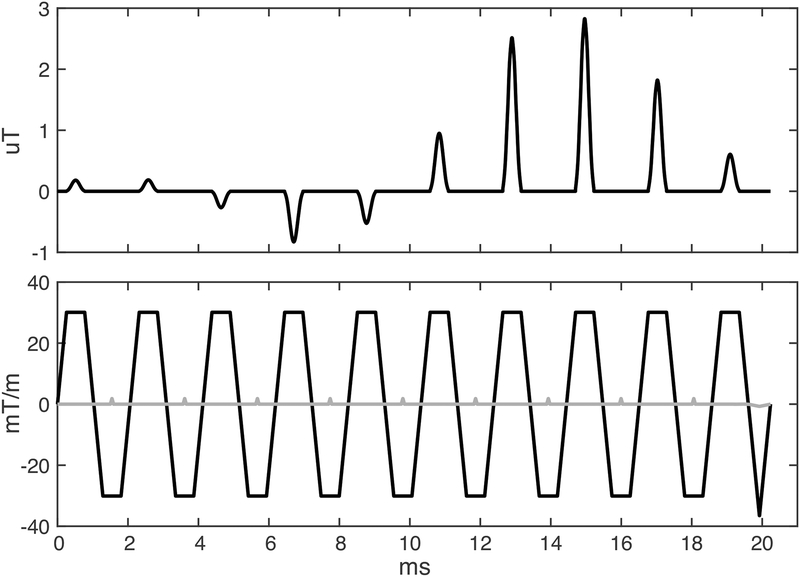
Figure 1:
Two-dimensional RF pulse and gradient waveforms. The z (slice) gradient is plotted in black, and the y (phase) gradient is plotted in grey. The RF pulse is scaled for a flip angle of 30 degrees, and the gradient is scaled for a slice thickness of 3 mm, which were the values used in all scans in this study. The y-gradient is scaled for a slab thickness of 100 mm.

