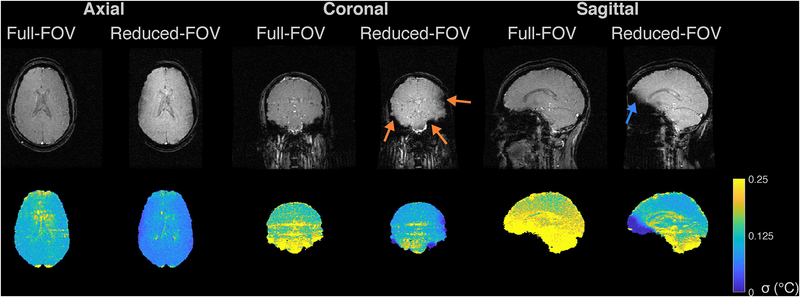
Figure 2:
In vivo temperature precision. The top row shows the magnitudes of the baseline (first time point) images, in three planes for the full- and reduced-FOV sequences. The second row shows corresponding through-time temperature standard deviation maps. The orange arrows in the coronal reduced-FOV image point to regions of signal loss where off-resonance caused the brain tissue to fall out of the two-dimensional pulse’s passband, and the blue arrow points to a region of signal loss in the sagittal image.

