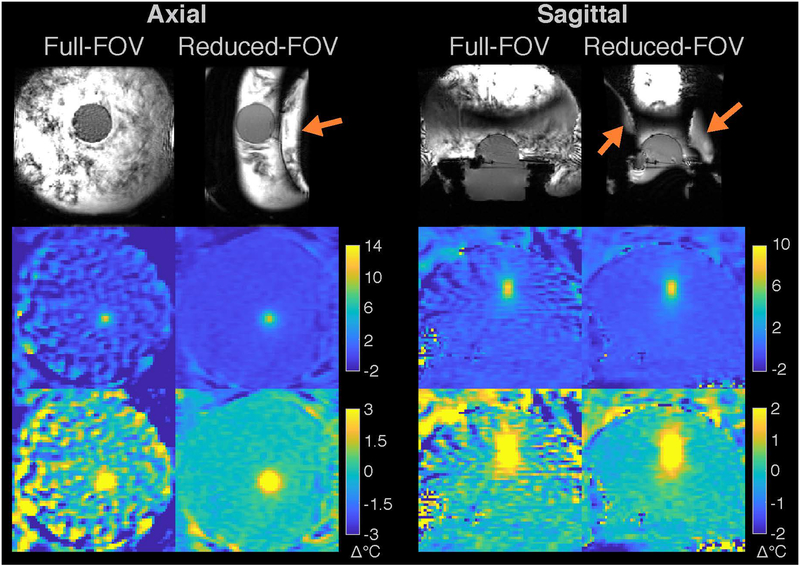
Figure 3:
Temperature maps measured in a gel phantom during FUS heating. The top row shows the magnitudes of the baseline (second time point) images for the full- and reduced-FOV sequences, in axial and coronal slice orientations. The reduced-FOV pulse successfully excited the phantom region in both cases, but also excited the outer edge of water bath due to the narrow 70 mm slab width, which was prevented from aliasing into the phantom by appropriate adjustment of the phase encode FOV (orange arrows). The second row shows temperature maps zoomed-in to the phantom at peak heat, and the third row shows the same maps with windowing adjusted to better visualize background temperature errors.

