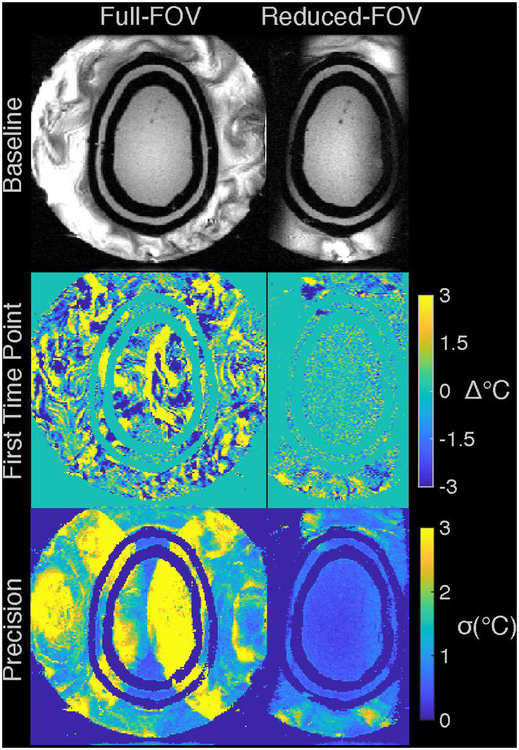
Figure 5:
Head phantom results. The top row shows the magnitudes of the fully-sampled baseline (second time point) images, for the full-FOV and reduced-FOV sequences. The second row shows temperature maps reconstructed by the k-space hybrid method from the k-space data of the first point in the time series (immediately after the baseline), which was uniformly 2x-undersampled in the left-right/phase-encoded dimension. The third row shows through-time temperature standard deviation maps.

