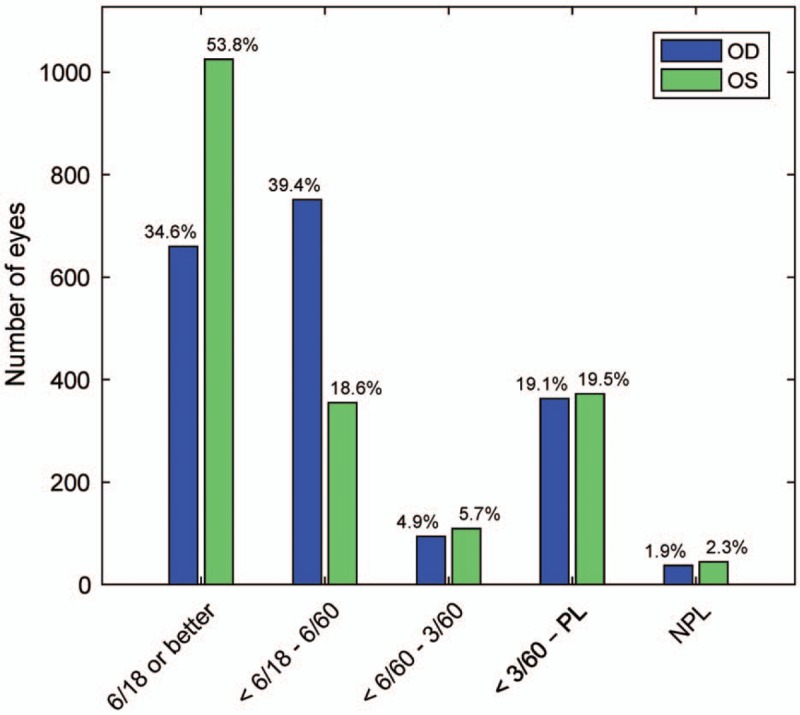
FIGURE 3.

Presenting BCVA. The presenting BCVAs provided significant asymmetries between eyes (P < 0.0001, Bonferroni corrected) in the 2 groups with acuities of 6/60 or better (chi-square = 158 for “6/18 or better”, and 283 for “6/18 to 6/60”). BCVA indicates best corrected visual acuity; NPL, no perception of light; PL, perception of light.
