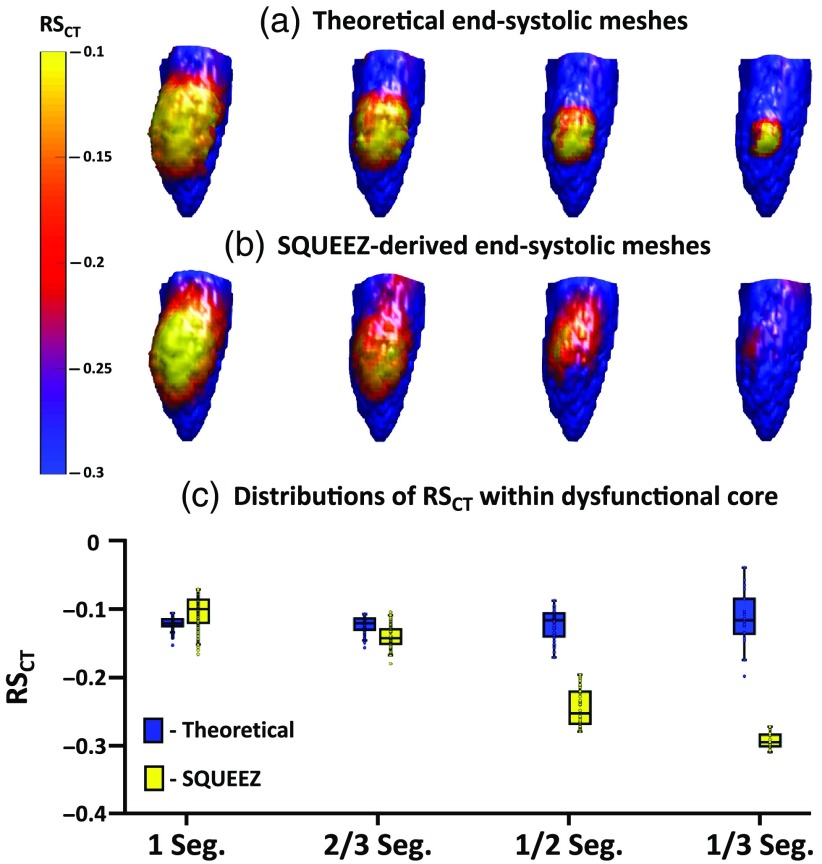
Fig. 5.
Detection of hypokinesia with SQUEEZ for four different sizes of regional dysfunction. (a), (b) End-systolic LV poses showing the anterior wall with values mapped onto the endocardial surface for the four sizes of regional dysfunction [(a) programmed ground-truth maps; (b) maps obtained with SQUEEZ]. Yellow corresponds to low function and blue corresponds to normal function. (c) Boxplots of ground-truth and SQUEEZ-derived values within the core of each of the four dysfunctional regions.

