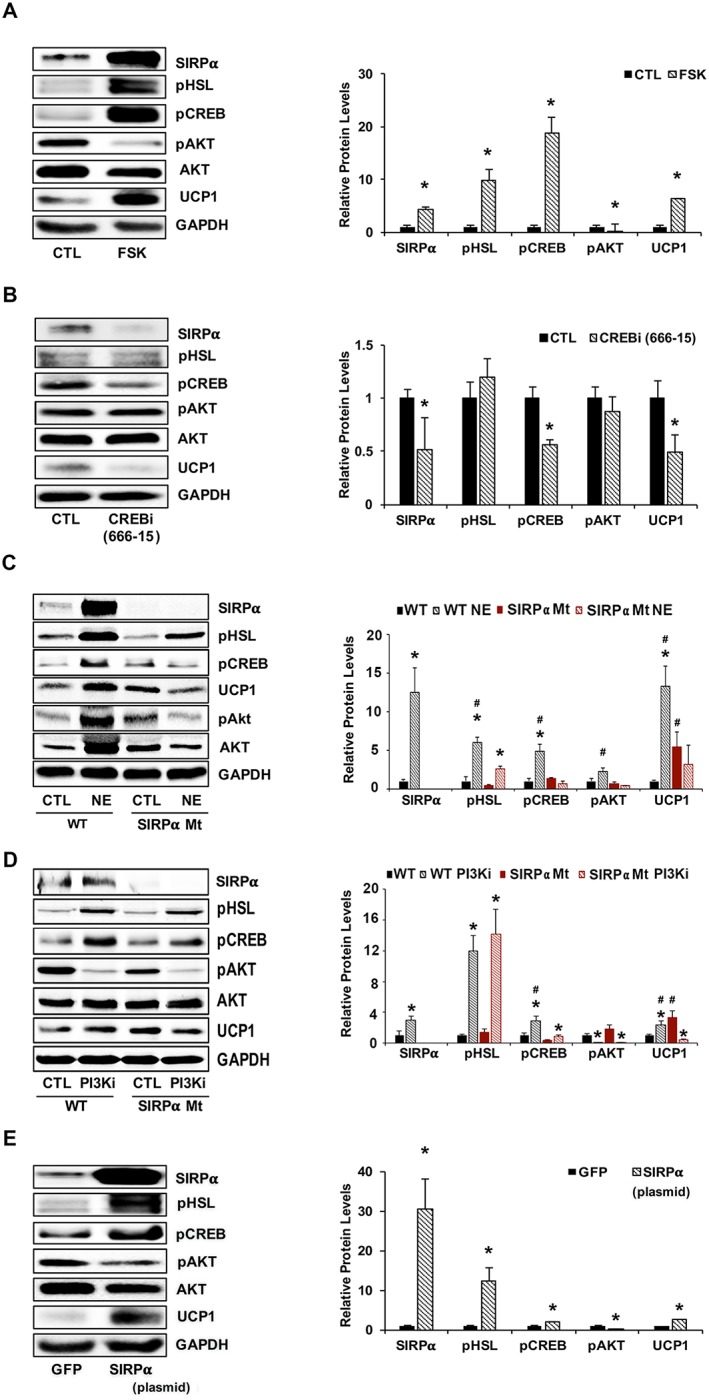
Figure 5.

PKA activates CREB, stimulating SIRPα and interfering with insulin signalling. (A) 3T3‐L1 adipocytes were treated with forskolin (FSK, 10 μM) for 24 h, and lysates immunoblotted (left panel) for relative densities to GAPDH or pAkt to AKT are shown (right panel) for SIRPα, pHSL, pCREB, pAkt (Ser473), Akt, and UCP1 (n = 4 independent experiments). (B) 3T3‐L1 adipocytes were treated for 24 h with 50 nM CREB inhibitor (compound 666‐15) and lysates were immunoblotted (left panel) for SIRPα, pHSL, pCREB, pAkt (Ser473), Akt, UCP1, and GAPDH, and relative densities to GAPDH or pAkt to AKT are shown ( right panel; n = 4 independent experiments). (C) Mice treated with 1 mg/kg noradrenaline bitartrate (NE) for 2 h were compared with vehicle‐treated mice. iWAT was homogenized and immunoblotted (left panel) for SIRPα, pHSL, pCREB, pAkt (Ser473), Akt, and UCP1, and relative densities that obtained to GAPDH or pAkt to AKT are shown (right panel; n = 4–6 mice/group). (D) Primary cultures of iWAT from WT or SIRPα Mt mice were treated with or without a PI3K inhibitor (PI3Ki) at 50 μM for 6 h. Lysates from these cells were immunoblotted (left panel) for SIRPα, pHSL, pCREB, pAkt (Ser473), Akt, and UCP1; and relative densities obtained to GAPDH or pAkt to AKT are shown (right panel; n = 4 independent experiments). (E) 3T3‐L1 adipocytes were transfected with a plasmid stimulating SIRPα expression and compared with results from a plasmid that expresses green fluorescent protein (GFP). Lysates were immunoblotted (left panel) for SIRPα, pHSL, pCREB, pAkt (Ser473), Akt, and UCP1; and relative densities obtained to GAPDH or pAkt to AKT are shown (right panel; n = 4 independent experiments). Values are a mean ± SEM. (A–B, E) *P < 0.05, control vs. treatment. (C–D) *P < 0.05, control vs. treatment and #P < 0.05, WT vs. SIRPα Mt mice. See also Figure S4.
