Figure 8.

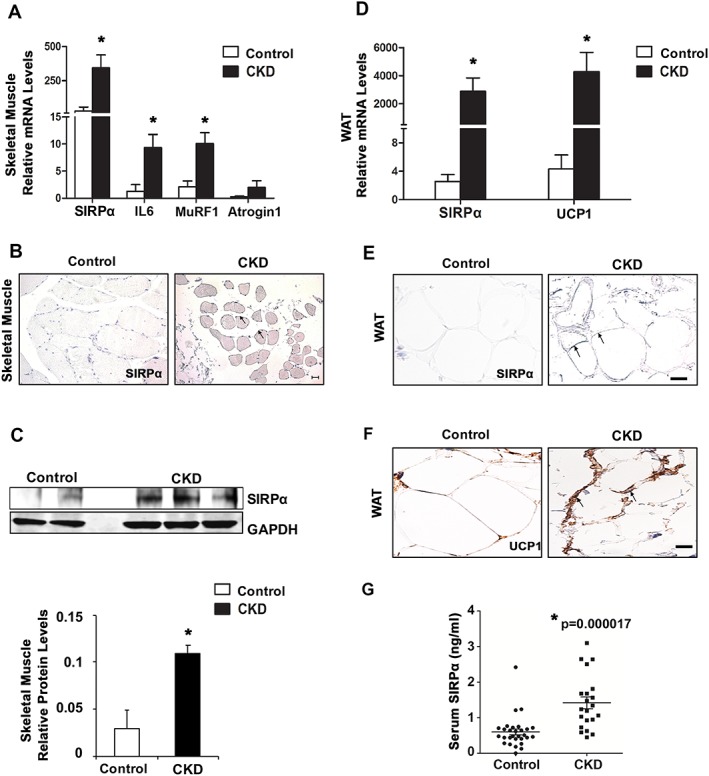
Patients with CKD expressed up‐regulation of SIRPα, atrophy‐related genes and browning of WAT (n = 7–9 patients/group). (A) mRNAs of skeletal muscles were determined on the basis of RT–qPCR analysis. (B) Immunostaining of muscle sections for SIRPα (see arrows) from biopsies of age‐matched, healthy control subjects and CKD patients. (C) Skeletal muscle lysates were immunoblotted (top panel) for SIRPα; and relative densities obtained to GAPDH are shown (bottom panel). (D) mRNAs of white adipose tissue (WAT) samples were determined on the basis of RT–qPCR analysis. Immunostaining of WAT sections for (E) SIRPα (see arrows) and (F) UCP1 (see arrows) was performed on healthy control subjects and CKD patients (scale bar = 100 μm). (G) Serum was obtained from patients with CKD vs. healthy controls, and ELISA was performed to detect circulating serum levels of SIRPα (n = 21–29 patients/group). Values are mean ± SEM. *P < 0.05 vs. control. See also Table S1.
