
Figure 5.
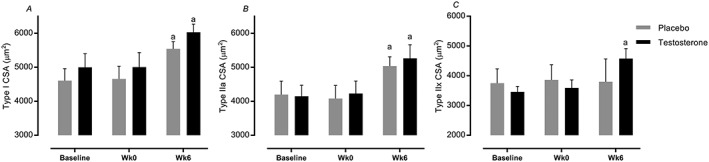
(A–C) Time course of changes in fibre‐type cross‐section area (CSA). Values are means ± standard error of the mean. aSignificantly different from baseline, P < 0.05; bsignificantly different between two groups, P < 0.05.
Official websites use .gov
A
.gov website belongs to an official
government organization in the United States.
Secure .gov websites use HTTPS
A lock (
) or https:// means you've safely
connected to the .gov website. Share sensitive
information only on official, secure websites.
(A–C) Time course of changes in fibre‐type cross‐section area (CSA). Values are means ± standard error of the mean. aSignificantly different from baseline, P < 0.05; bsignificantly different between two groups, P < 0.05.