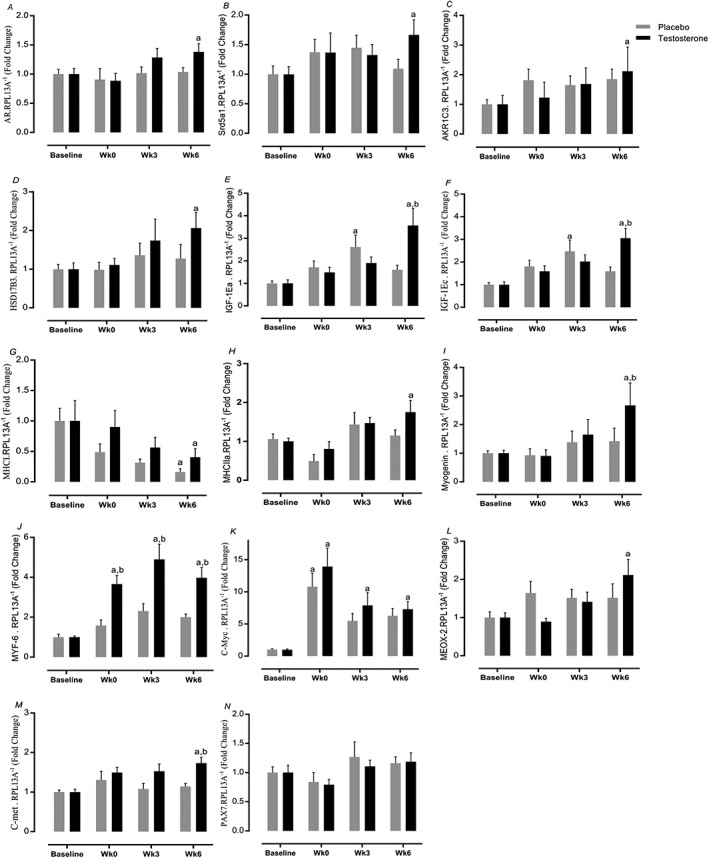
Figure 9.

Muscle gene expression. Changes in testosterone and placebo in (A–D) testosterone metabolism gene expression, (E, F) anabolism, (G, H) fibre type, and (I–N) myogenic from baseline to Week 6. Values are means ± standard error of the mean. aSignificantly different from baseline, P < 0.05; bsignificantly different between two groups, P < 0.05.
